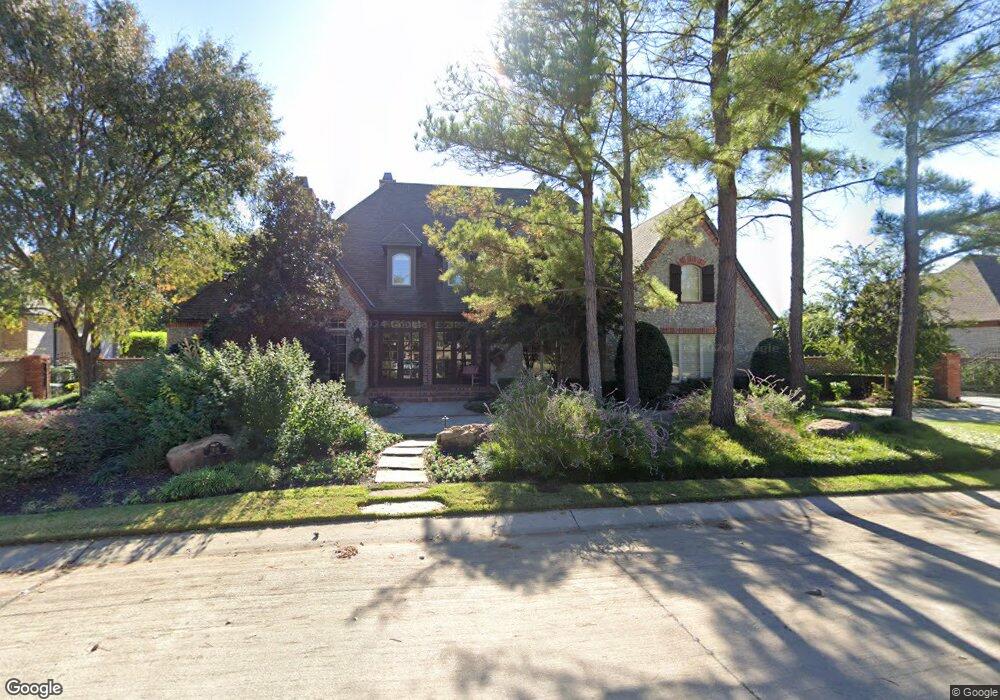
1426 Eagle Bend Southlake, TX 76092
Estimated Value: $2,253,000 - $2,442,000
4
Beds
6
Baths
5,853
Sq Ft
$404/Sq Ft
Est. Value
About This Home
This home is located at 1426 Eagle Bend, Southlake, TX 76092 and is currently estimated at $2,363,808, approximately $403 per square foot. 1426 Eagle Bend is a home located in Tarrant County with nearby schools including Robert High Rockenbaugh Elementary School, Eubanks Intermediate School, and George Dawson Middle School.
Ownership History
Date
Name
Owned For
Owner Type
Purchase Details
Closed on
Sep 29, 2011
Sold by
Jacques Aj and Jacques Susan
Bought by
Smetko Craig N and Smetko Lynn F
Current Estimated Value
Purchase Details
Closed on
Oct 18, 2005
Sold by
Hinterlong Bernard J and Hinterlong Renette A
Bought by
Jacques A J and Jacques Susan
Purchase Details
Closed on
Apr 3, 2002
Sold by
Ritz Properties Ltd
Bought by
Hinterlong Bernard J and Hinterlong Renette A
Home Financials for this Owner
Home Financials are based on the most recent Mortgage that was taken out on this home.
Original Mortgage
$825,000
Interest Rate
4.37%
Purchase Details
Closed on
Apr 12, 2001
Sold by
Southlake Residential Properties Ltd
Bought by
Ritz Properties Ltd
Home Financials for this Owner
Home Financials are based on the most recent Mortgage that was taken out on this home.
Original Mortgage
$800,000
Interest Rate
6.93%
Create a Home Valuation Report for This Property
The Home Valuation Report is an in-depth analysis detailing your home's value as well as a comparison with similar homes in the area
Home Values in the Area
Average Home Value in this Area
Purchase History
| Date | Buyer | Sale Price | Title Company |
|---|---|---|---|
| Smetko Craig N | -- | Rtc | |
| Jacques A J | -- | First American Title Co | |
| Hinterlong Bernard J | -- | American Title Co | |
| Ritz Properties Ltd | -- | American Title Co |
Source: Public Records
Mortgage History
| Date | Status | Borrower | Loan Amount |
|---|---|---|---|
| Previous Owner | Hinterlong Bernard J | $825,000 | |
| Previous Owner | Ritz Properties Ltd | $800,000 |
Source: Public Records
Tax History Compared to Growth
Tax History
| Year | Tax Paid | Tax Assessment Tax Assessment Total Assessment is a certain percentage of the fair market value that is determined by local assessors to be the total taxable value of land and additions on the property. | Land | Improvement |
|---|---|---|---|---|
| 2025 | $21,006 | $1,798,000 | $541,500 | $1,256,500 |
| 2024 | $21,006 | $1,973,295 | $541,500 | $1,431,795 |
| 2023 | $25,475 | $2,072,278 | $541,500 | $1,530,778 |
| 2022 | $27,412 | $1,755,003 | $338,438 | $1,416,565 |
| 2021 | $26,337 | $1,155,114 | $338,438 | $816,676 |
| 2020 | $26,637 | $1,158,819 | $338,438 | $820,381 |
| 2019 | $29,345 | $1,211,856 | $412,500 | $799,356 |
| 2018 | $29,453 | $1,277,713 | $503,125 | $774,588 |
| 2017 | $32,386 | $1,306,620 | $550,000 | $756,620 |
| 2016 | $29,991 | $1,246,765 | $601,562 | $645,203 |
| 2015 | $26,819 | $1,100,000 | $200,000 | $900,000 |
| 2014 | $26,819 | $1,100,000 | $200,000 | $900,000 |
Source: Public Records
Map
Nearby Homes
- 608 Regency Crossing
- 1227 Strathmore Dr
- 1420 Kensington Ct
- 521 Regency Crossing
- 7322 Calloway Ct
- 7316 Calloway Ct
- 1417 Nottoway Ct
- 1418 Nottoway Ct
- 1406 Nottoway Ct
- 7312 Hix Ct
- 7255 Oak Alley Dr
- 7200 Belle Meade Dr
- 7106 Belle Meade Dr
- 7012 Shepherds Glen
- 710 Longford Dr
- 7208 Stilton Ct
- TBD - Lot 3 John Mccain Rd
- TBD - Lot 1 John Mccain Rd
- 708 Nettleton Dr
- 1719 Byron Nelson Pkwy
- 1430 Eagle Bend
- 1422 Eagle Bend
- 1434 Eagle Bend
- 502 Villa Crossing
- 504 Villa Crossing
- 511 Villa Crossing
- 1414 Eagle Bend
- 513 Villa Crossing
- 1436 Eagle Bend
- 515 Villa Crossing
- 506 Villa Crossing
- 1417 Eagle Bend
- 508 Villa Crossing
- 517 Villa Crossing
- 510 Villa Crossing
- 512 Villa Crossing
- 1435 Eagle Bend
- 1440 Eagle Bend
- 519 Villa Crossing
- 1410 Eagle Bend