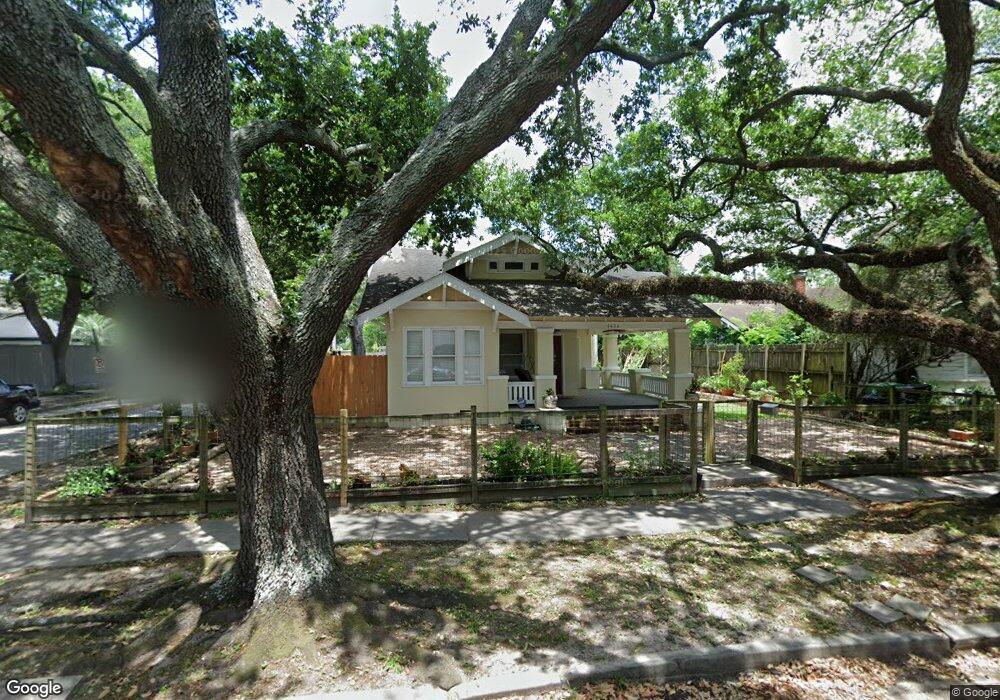
1426 Kipling St Houston, TX 77006
Montrose NeighborhoodEstimated Value: $730,000 - $842,000
3
Beds
2
Baths
2,176
Sq Ft
$361/Sq Ft
Est. Value
About This Home
This home is located at 1426 Kipling St, Houston, TX 77006 and is currently estimated at $785,765, approximately $361 per square foot. 1426 Kipling St is a home located in Harris County with nearby schools including Baker Montessori, Lanier Middle School, and Lamar High School.
Ownership History
Date
Name
Owned For
Owner Type
Purchase Details
Closed on
Jan 1, 2014
Sold by
Benie George Sajju and Benie George
Bought by
George Joseph and George Mary
Current Estimated Value
Purchase Details
Closed on
Jun 30, 2010
Sold by
Blair Whitney P and Leibo Beth
Bought by
George Sajju and George Benie C
Home Financials for this Owner
Home Financials are based on the most recent Mortgage that was taken out on this home.
Original Mortgage
$284,000
Outstanding Balance
$189,569
Interest Rate
4.81%
Mortgage Type
New Conventional
Estimated Equity
$596,196
Purchase Details
Closed on
Apr 29, 2004
Sold by
Hooker Wallace K and Harrison Honey
Bought by
Blair Whitney P and Leibo Beth
Home Financials for this Owner
Home Financials are based on the most recent Mortgage that was taken out on this home.
Original Mortgage
$192,000
Interest Rate
5.38%
Mortgage Type
Purchase Money Mortgage
Create a Home Valuation Report for This Property
The Home Valuation Report is an in-depth analysis detailing your home's value as well as a comparison with similar homes in the area
Home Values in the Area
Average Home Value in this Area
Purchase History
| Date | Buyer | Sale Price | Title Company |
|---|---|---|---|
| George Joseph | -- | None Available | |
| George Sajju | -- | American Title Company | |
| Blair Whitney P | -- | Stewart Title |
Source: Public Records
Mortgage History
| Date | Status | Borrower | Loan Amount |
|---|---|---|---|
| Open | George Sajju | $284,000 | |
| Previous Owner | Blair Whitney P | $192,000 |
Source: Public Records
Tax History Compared to Growth
Tax History
| Year | Tax Paid | Tax Assessment Tax Assessment Total Assessment is a certain percentage of the fair market value that is determined by local assessors to be the total taxable value of land and additions on the property. | Land | Improvement |
|---|---|---|---|---|
| 2025 | $7,213 | $945,233 | $816,840 | $128,393 |
| 2024 | $7,213 | $888,281 | $748,770 | $139,511 |
| 2023 | $7,213 | $897,848 | $748,770 | $149,078 |
| 2022 | $14,797 | $672,028 | $544,560 | $127,468 |
| 2021 | $15,009 | $644,000 | $544,560 | $99,440 |
| 2020 | $14,647 | $604,851 | $522,280 | $82,571 |
| 2019 | $14,250 | $563,157 | $522,280 | $40,877 |
| 2018 | $7,953 | $546,400 | $489,638 | $56,762 |
| 2017 | $14,244 | $546,400 | $489,638 | $56,762 |
| 2016 | $12,949 | $488,000 | $424,353 | $63,647 |
| 2015 | $9,656 | $487,640 | $424,353 | $63,287 |
| 2014 | $9,656 | $445,564 | $359,068 | $86,496 |
Source: Public Records
Map
Nearby Homes
- 3540 Yupon St
- 1503 Harold St
- 3515 Yupon St
- 1507 Kipling St
- 3403 Yupon St
- 1511 Kipling St
- 1517 Kipling St
- 1510 Marshall St
- 3311 Yupon St Unit 611
- 3311 Yupon St Unit 519
- 1512 W Alabama St
- 1621 California St
- 1540 Hawthorne St Unit 4
- 1531 Marshall St Unit 3
- 1539 Westheimer Rd
- 3705 Mandell St Unit 8
- 1612 Kipling St
- 1620 Harold St
- 1612 W Alabama St Unit ABCD
- 1101 Hawthorne St
- 1424 Kipling St
- 1422 Kipling St
- 1502 Kipling St
- 1423 Harold St
- 1421 Harold St
- 1420 Kipling St
- 1501 Harold St
- 1504 Kipling St
- 1419 Harold St
- 1425 Kipling St
- 1501 Kipling St
- 1418 Kipling St
- 11935 Mulberry St
- 1417 Harold St
- 1417 Harold St
- 1417 Harold St Unit B
- 1508 Kipling St
- 1507 Harold St
- 1423 Kipling St Unit 1
- 1423 Kipling St Unit 5