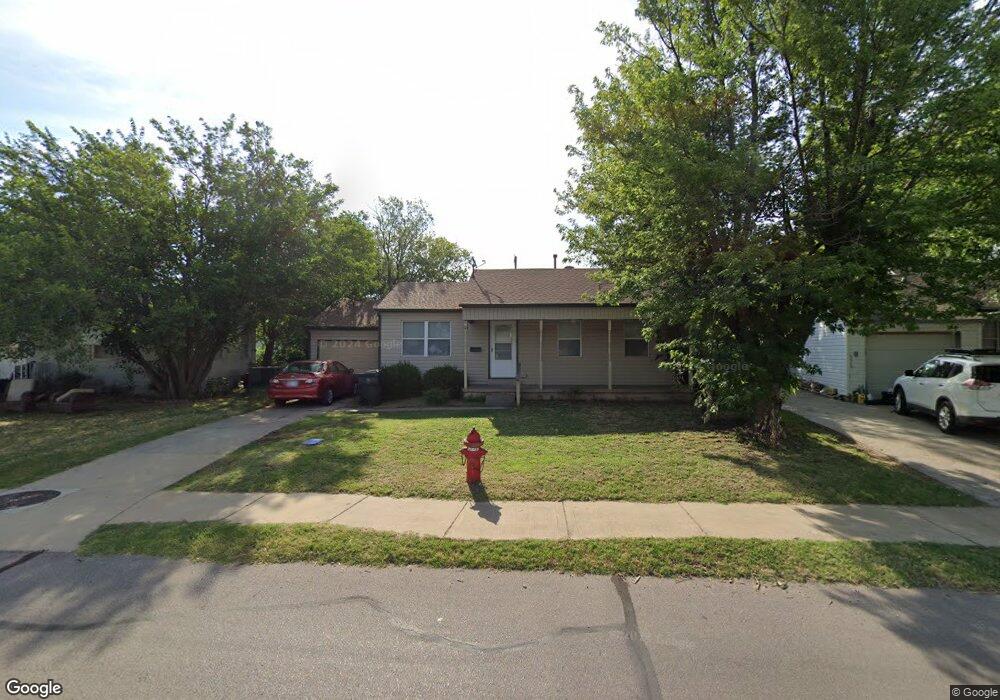
1426 Maple Dr Oklahoma City, OK 73110
Estimated Value: $97,000 - $113,000
2
Beds
1
Bath
714
Sq Ft
$149/Sq Ft
Est. Value
About This Home
This home is located at 1426 Maple Dr, Oklahoma City, OK 73110 and is currently estimated at $106,694, approximately $149 per square foot. 1426 Maple Dr is a home located in Oklahoma County with nearby schools including Country Estates Elementary School, Midwest City Middle School, and Midwest City High School.
Ownership History
Date
Name
Owned For
Owner Type
Purchase Details
Closed on
May 6, 2020
Sold by
Carter Tina and Carter Gary L
Bought by
Westchester Real Estate Llc
Current Estimated Value
Purchase Details
Closed on
Jul 1, 2017
Sold by
Duncan Helen J and Duncan Robert E
Bought by
Bilyeu Jeanise and Carter Tina
Purchase Details
Closed on
Jun 28, 2012
Sold by
Bryan Helen J and Williams Teresa
Bought by
Duncan Helen J and Williams Teresa
Purchase Details
Closed on
Oct 24, 2003
Sold by
Bryan Helen J
Bought by
Bryan Helen J and Williams Teresa
Purchase Details
Closed on
May 28, 1999
Sold by
Shipley Perrick L and Shipley Julie T
Bought by
Bryan Helen J
Purchase Details
Closed on
Sep 25, 1998
Sold by
Lupton Gary Don and Lupton Diane Jeanette
Bought by
Shipley Derrick L and Shipley Julie T
Purchase Details
Closed on
Sep 24, 1998
Sold by
Lupton Paul E and Lupton Rosalie A
Bought by
Lupton Gary D and Lupton Diane
Create a Home Valuation Report for This Property
The Home Valuation Report is an in-depth analysis detailing your home's value as well as a comparison with similar homes in the area
Home Values in the Area
Average Home Value in this Area
Purchase History
| Date | Buyer | Sale Price | Title Company |
|---|---|---|---|
| Westchester Real Estate Llc | $39,000 | Old Republic Title | |
| Bilyeu Jeanise | -- | Os Title | |
| Duncan Helen J | -- | None Available | |
| Bryan Helen J | -- | -- | |
| Bryan Helen J | $40,500 | -- | |
| Shipley Derrick L | $35,500 | -- | |
| Lupton Gary D | -- | -- |
Source: Public Records
Tax History Compared to Growth
Tax History
| Year | Tax Paid | Tax Assessment Tax Assessment Total Assessment is a certain percentage of the fair market value that is determined by local assessors to be the total taxable value of land and additions on the property. | Land | Improvement |
|---|---|---|---|---|
| 2024 | $821 | $7,321 | $1,476 | $5,845 |
| 2023 | $821 | $6,973 | $1,037 | $5,936 |
| 2022 | $775 | $6,641 | $1,138 | $5,503 |
| 2021 | $756 | $6,325 | $1,300 | $5,025 |
| 2020 | $621 | $5,059 | $1,184 | $3,875 |
| 2019 | $566 | $4,818 | $1,013 | $3,805 |
| 2018 | $506 | $4,590 | $0 | $0 |
| 2017 | $489 | $4,370 | $974 | $3,396 |
| 2016 | $479 | $4,162 | $937 | $3,225 |
| 2015 | $475 | $3,964 | $1,050 | $2,914 |
| 2014 | $452 | $3,775 | $1,018 | $2,757 |
Source: Public Records
Map
Nearby Homes
- 210 E Myrtle Dr
- 109 E Northrup Dr
- 202 E Northrup Dr
- 408 Elm St
- 133 W Steed Dr
- 1613 Sandra Dr
- 102 E Lilac Ln
- 441 E Showalter Dr
- 201 E Key Blvd
- 501 E Showalter Dr
- 509 E Rose Dr
- 1701 Rulane Dr
- 209 W Glenhaven Dr
- 6609 SE 15th St
- 204 E Coe Dr
- 1800 N Mitchell Dr
- 608 W Rickenbacker Dr
- 125 W Coe Dr
- 216 W Coe Dr
- 518 E Lockheed Dr