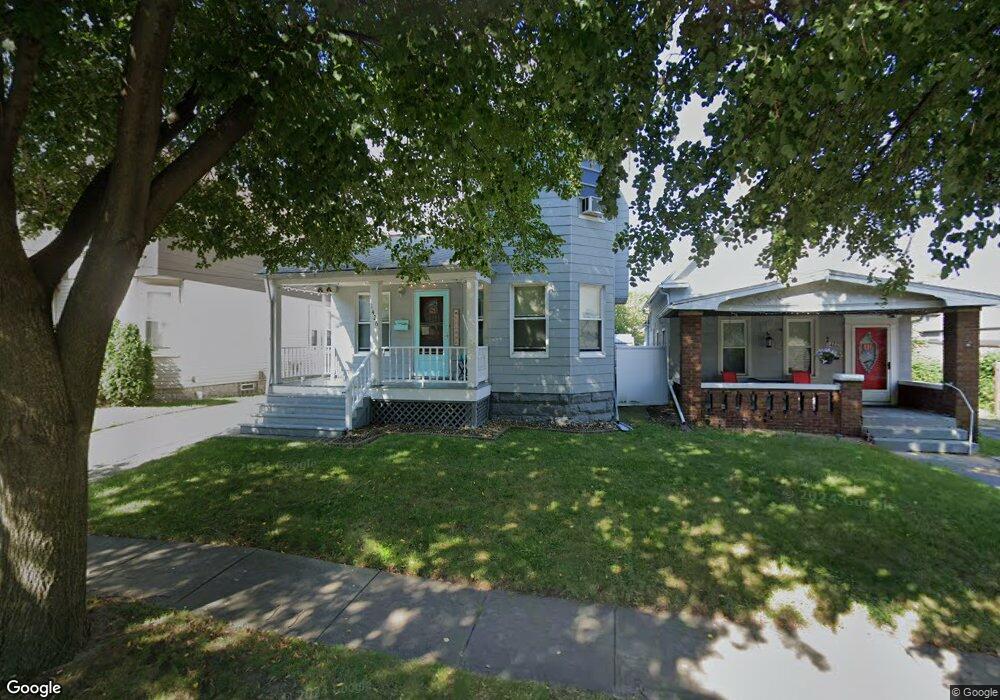
1426 Winchester Ave Lakewood, OH 44107
Estimated Value: $230,000 - $320,000
4
Beds
1
Bath
1,436
Sq Ft
$189/Sq Ft
Est. Value
About This Home
This home is located at 1426 Winchester Ave, Lakewood, OH 44107 and is currently estimated at $272,060, approximately $189 per square foot. 1426 Winchester Ave is a home with nearby schools including Harrison Elementary School, Garfield Middle School, and Lakewood High School.
Ownership History
Date
Name
Owned For
Owner Type
Purchase Details
Closed on
Jul 17, 1995
Sold by
King Albert
Bought by
Handy Ernest L and Handy Theresa
Current Estimated Value
Home Financials for this Owner
Home Financials are based on the most recent Mortgage that was taken out on this home.
Original Mortgage
$69,000
Interest Rate
7.79%
Mortgage Type
New Conventional
Purchase Details
Closed on
Oct 19, 1984
Sold by
Koney Gregory A
Bought by
King Albert
Purchase Details
Closed on
Apr 20, 1981
Sold by
Lampshire Kevin W
Bought by
Koney Gregory A
Purchase Details
Closed on
Nov 6, 1980
Sold by
Janet Nelson Udvary
Bought by
Lampshire Kevin W
Purchase Details
Closed on
Nov 23, 1979
Sold by
Udvary Alex
Bought by
Janet Nelson Udvary
Purchase Details
Closed on
Nov 12, 1976
Sold by
Tillman Joseph L
Bought by
Udvary Alex
Purchase Details
Closed on
Jan 1, 1975
Bought by
Wald Eric D
Create a Home Valuation Report for This Property
The Home Valuation Report is an in-depth analysis detailing your home's value as well as a comparison with similar homes in the area
Home Values in the Area
Average Home Value in this Area
Purchase History
| Date | Buyer | Sale Price | Title Company |
|---|---|---|---|
| Handy Ernest L | $75,000 | -- | |
| King Albert | $44,000 | -- | |
| Koney Gregory A | $32,500 | -- | |
| Lampshire Kevin W | $28,500 | -- | |
| Janet Nelson Udvary | -- | -- | |
| Udvary Alex | $21,000 | -- | |
| Tillman Joseph L | $19,500 | -- | |
| Wald Eric D | -- | -- |
Source: Public Records
Mortgage History
| Date | Status | Borrower | Loan Amount |
|---|---|---|---|
| Closed | Handy Ernest L | $69,000 |
Source: Public Records
Tax History Compared to Growth
Tax History
| Year | Tax Paid | Tax Assessment Tax Assessment Total Assessment is a certain percentage of the fair market value that is determined by local assessors to be the total taxable value of land and additions on the property. | Land | Improvement |
|---|---|---|---|---|
| 2024 | $4,701 | $73,185 | $13,895 | $59,290 |
| 2023 | $3,972 | $52,920 | $10,990 | $41,930 |
| 2022 | $3,997 | $52,920 | $10,990 | $41,930 |
| 2021 | $3,957 | $52,920 | $10,990 | $41,930 |
| 2020 | $3,188 | $37,280 | $7,740 | $29,540 |
| 2019 | $3,125 | $106,500 | $22,100 | $84,400 |
| 2018 | $3,121 | $37,280 | $7,740 | $29,540 |
| 2017 | $3,268 | $35,460 | $8,540 | $26,920 |
| 2016 | $3,245 | $35,460 | $8,540 | $26,920 |
| 2015 | $3,377 | $35,460 | $8,540 | $26,920 |
| 2014 | $3,377 | $35,460 | $8,540 | $26,920 |
Source: Public Records
Map
Nearby Homes
- 12115 Detroit Ave
- 12110 Detroit Ave
- 12118 Detroit Ave
- 12122 Detroit Ave
- 1391 Beach Ave
- 11901 Detroit Ave
- 1486 Hopkins Ave
- 1518 Hopkins Ave
- 1341 Beach Ave
- 1323 Beach Ave
- 1484 Alameda Ave
- 11915 Franklin Blvd
- 1569 Newman Ave
- 11801 Franklin Blvd
- 1584 Newman Ave
- 1346 Thoreau Rd
- 12029 Clifton Blvd Unit 101
- 1622 Winchester Ave
- 1585 Cohassett Ave
- 1598 Alameda Ave
- 1422 Winchester Ave
- 1422 Winchester Ave Unit 3
- 1430 Winchester Ave
- 1418 Winchester Ave
- 1416 Winchester Ave
- 1434 Winchester Ave
- 1414 Winchester Ave
- 1423 Winchester Ave
- 1438 Winchester Ave
- 1419 Winchester Ave
- 1427 Winchester Ave
- 1427 Winchester Ave Unit Upper
- 1431 Ridgewood Ave
- 1425 Ridgewood Ave
- 1431 Winchester Ave
- 1415 Winchester Ave
- 1435 Winchester Ave
- 1433 Ridgewood Ave
- 1442 Winchester Ave
- 1423 Ridgewood Ave