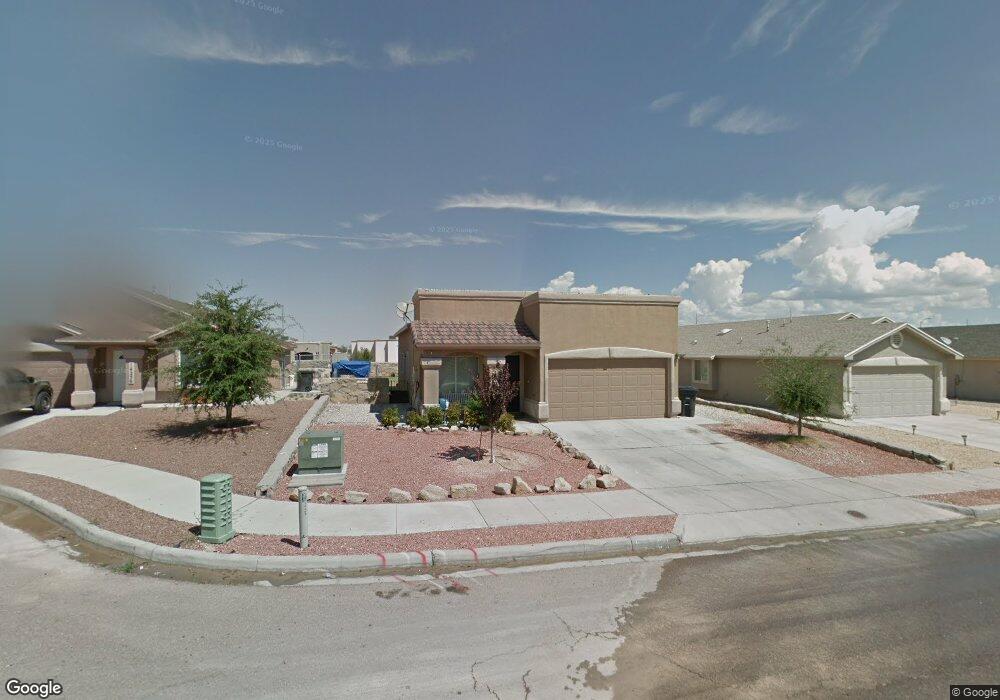
14263 Desert Cactus Dr Unit 1 Horizon City, TX 79928
Estimated Value: $202,000 - $216,000
4
Beds
2
Baths
1,342
Sq Ft
$158/Sq Ft
Est. Value
About This Home
This home is located at 14263 Desert Cactus Dr Unit 1, Horizon City, TX 79928 and is currently estimated at $211,741, approximately $157 per square foot. 14263 Desert Cactus Dr Unit 1 is a home located in El Paso County with nearby schools including Desert Hills Elementary School, Horizon Middle School, and Horizon High School.
Ownership History
Date
Name
Owned For
Owner Type
Purchase Details
Closed on
Jan 2, 2015
Sold by
Dominguez Alfredo
Bought by
Olivas Suzeth G and Perez Jorge Najera
Current Estimated Value
Home Financials for this Owner
Home Financials are based on the most recent Mortgage that was taken out on this home.
Original Mortgage
$129,900
Interest Rate
3.73%
Mortgage Type
Purchase Money Mortgage
Purchase Details
Closed on
Nov 2, 2012
Sold by
Cornelious Mcconnell Andrew John
Bought by
Dominguez Alfredo
Purchase Details
Closed on
Jun 30, 2010
Sold by
Saratoga Homes Horizon Llc
Bought by
Mcconnell Randall J
Home Financials for this Owner
Home Financials are based on the most recent Mortgage that was taken out on this home.
Original Mortgage
$127,636
Interest Rate
4.78%
Mortgage Type
VA
Create a Home Valuation Report for This Property
The Home Valuation Report is an in-depth analysis detailing your home's value as well as a comparison with similar homes in the area
Home Values in the Area
Average Home Value in this Area
Purchase History
| Date | Buyer | Sale Price | Title Company |
|---|---|---|---|
| Olivas Suzeth G | -- | None Available | |
| Dominguez Alfredo | -- | None Available | |
| Mcconnell Randall J | -- | None Available |
Source: Public Records
Mortgage History
| Date | Status | Borrower | Loan Amount |
|---|---|---|---|
| Previous Owner | Olivas Suzeth G | $129,900 | |
| Previous Owner | Mcconnell Randall J | $127,636 |
Source: Public Records
Tax History Compared to Growth
Tax History
| Year | Tax Paid | Tax Assessment Tax Assessment Total Assessment is a certain percentage of the fair market value that is determined by local assessors to be the total taxable value of land and additions on the property. | Land | Improvement |
|---|---|---|---|---|
| 2025 | $4,264 | $185,682 | -- | -- |
| 2024 | $4,264 | $168,802 | -- | -- |
| 2023 | $4,264 | $153,456 | $0 | $0 |
| 2022 | $4,523 | $139,505 | $0 | $0 |
| 2021 | $4,525 | $153,102 | $22,431 | $130,671 |
| 2020 | $4,005 | $115,294 | $22,431 | $92,863 |
| 2018 | $3,841 | $114,436 | $22,431 | $92,005 |
| 2017 | $3,550 | $106,911 | $22,431 | $84,480 |
| 2016 | $3,550 | $106,911 | $22,431 | $84,480 |
| 2015 | $3,563 | $106,911 | $22,431 | $84,480 |
| 2014 | $3,563 | $112,769 | $22,431 | $90,338 |
Source: Public Records
Map
Nearby Homes
- 14267 Desert Cactus Dr
- 14395 Desert Sage Dr
- 14370 Desert Sage Dr
- 14240 Desert Mesquite Dr
- 816 Desert Moon Dr
- 14237 Desert Stone Dr
- 761 Desert Star Dr
- 757 Desert Star Dr
- 920 Sandhurst Place
- 753 Desert Silver Dr
- 916 Sandhurst Place
- 952 Sandhurst Place
- 933 Sandhurst Place
- 768 Paseo Del Agua St
- 760 Desert Ash Dr
- 916 Summer Lake St
- 13973 Lorenz Ave
- 13949 Lorenz Ave
- 737 Paseo Del Agua St
- 13945 Lorenz Ave
- 14263 Desert Cactus Dr
- 14267 Desert Cactus Dr Unit 1
- 14259 Desert Cactus Dr
- 14271 Desert Cactus Dr
- 14255 Desert Cactus Dr
- 14262 Desert Cactus Dr
- 840 Desert Cactus Dr
- 14258 Desert Cactus Dr Unit 1
- 14258 Desert Cactus Dr
- 14275 Desert Cactus Dr
- 14266 Desert Cactus Dr
- 14256 Desert Sky Dr
- 836 Desert Cactus Dr
- 14260 Desert Sky Dr
- 14270 Desert Cactus Dr
- 14252 Desert Sky Dr
- 14264 Desert Sky Dr
- 14248 Desert Sky Dr
- 14279 Desert Cactus Dr
- 832 Desert Cactus Dr