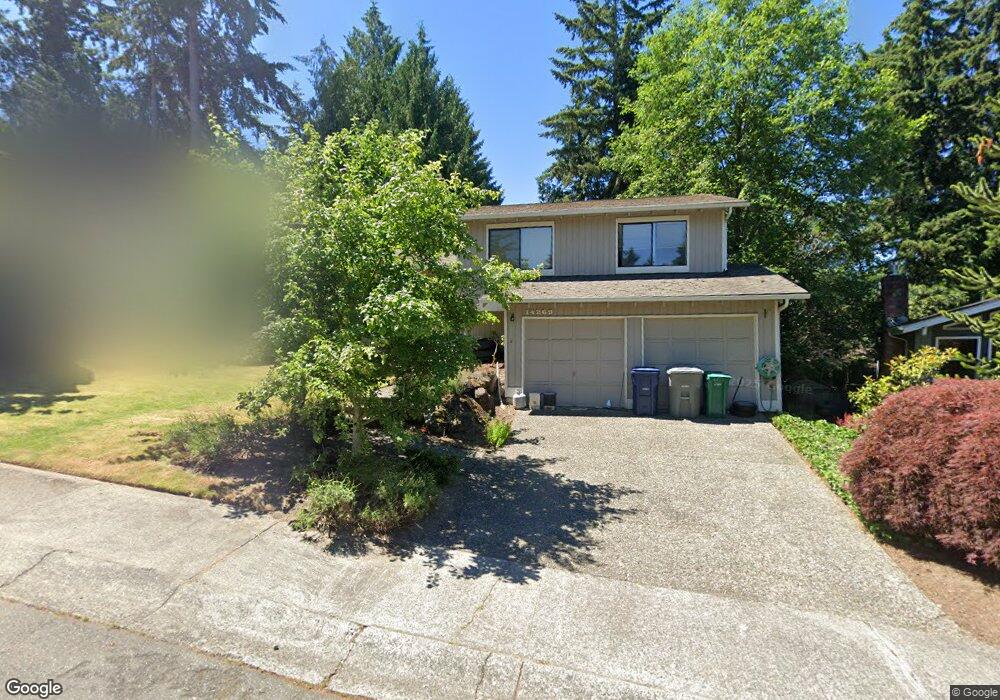
14269 92nd Place NE Bothell, WA 98011
Finn Hill NeighborhoodEstimated Value: $982,000 - $1,108,000
3
Beds
3
Baths
2,220
Sq Ft
$477/Sq Ft
Est. Value
About This Home
This home is located at 14269 92nd Place NE, Bothell, WA 98011 and is currently estimated at $1,059,546, approximately $477 per square foot. 14269 92nd Place NE is a home located in King County with nearby schools including Henry David Thoreau Elementary School, Finn Hill Middle School, and Juanita High School.
Ownership History
Date
Name
Owned For
Owner Type
Purchase Details
Closed on
Jun 9, 2005
Sold by
Reese Charles D and Reese Elizabeth H
Bought by
Deterra David J and Williams Katherine
Current Estimated Value
Home Financials for this Owner
Home Financials are based on the most recent Mortgage that was taken out on this home.
Original Mortgage
$292,000
Outstanding Balance
$147,408
Interest Rate
5.25%
Estimated Equity
$912,138
Purchase Details
Closed on
May 2, 2000
Sold by
Minagawa Dale E and Minagawa Jan S
Bought by
Reese Charles D and Reese Elizabeth H
Home Financials for this Owner
Home Financials are based on the most recent Mortgage that was taken out on this home.
Original Mortgage
$200,800
Interest Rate
8.25%
Purchase Details
Closed on
Feb 10, 1998
Sold by
Foreman Suzanne P and Overstreet Suzanne P
Bought by
Minagawa Jan S and Minagawa Dale E
Home Financials for this Owner
Home Financials are based on the most recent Mortgage that was taken out on this home.
Original Mortgage
$197,100
Interest Rate
6.97%
Create a Home Valuation Report for This Property
The Home Valuation Report is an in-depth analysis detailing your home's value as well as a comparison with similar homes in the area
Home Values in the Area
Average Home Value in this Area
Purchase History
| Date | Buyer | Sale Price | Title Company |
|---|---|---|---|
| Deterra David J | $365,000 | First American | |
| Reese Charles D | $251,000 | Evergreen Title Company Inc | |
| Minagawa Jan S | $207,500 | -- |
Source: Public Records
Mortgage History
| Date | Status | Borrower | Loan Amount |
|---|---|---|---|
| Open | Deterra David J | $292,000 | |
| Previous Owner | Reese Charles D | $200,800 | |
| Previous Owner | Minagawa Jan S | $197,100 | |
| Closed | Reese Charles D | $25,100 | |
| Closed | Deterra David J | $36,463 |
Source: Public Records
Tax History
| Year | Tax Paid | Tax Assessment Tax Assessment Total Assessment is a certain percentage of the fair market value that is determined by local assessors to be the total taxable value of land and additions on the property. | Land | Improvement |
|---|---|---|---|---|
| 2024 | $7,884 | $955,000 | $469,000 | $486,000 |
| 2023 | $7,845 | $818,000 | $383,000 | $435,000 |
| 2022 | $6,759 | $1,024,000 | $456,000 | $568,000 |
| 2021 | $6,251 | $747,000 | $332,000 | $415,000 |
| 2020 | $6,103 | $630,000 | $275,000 | $355,000 |
| 2018 | $4,541 | $483,000 | $250,000 | $233,000 |
| 2017 | $4,133 | $431,000 | $223,000 | $208,000 |
| 2016 | $3,971 | $408,000 | $211,000 | $197,000 |
| 2015 | $3,615 | $386,000 | $200,000 | $186,000 |
| 2014 | -- | $337,000 | $182,000 | $155,000 |
| 2013 | -- | $277,000 | $150,000 | $127,000 |
Source: Public Records
Map
Nearby Homes
- 14208 93rd Ave NE
- 14505 Simonds Rd NE Unit C
- 8713 NE 144th St
- 8801 NE 140th Place
- 14142 97th Ave NE
- 14107 97th Ave NE
- 8708 NE 140th St Unit A
- 13838 92nd Place NE
- 9919 NE 144th Ln Unit 606
- 9919 NE 144th Ln Unit U603
- 9813 NE 145th St
- 9904 NE 142nd Place Unit C302
- 9930 NE 144th Ln Unit 202
- 145 Xxx 100th Ave NE
- 15010 87th Ave NE
- 13750 97th Ave NE
- 9211 NE 136th Place
- 14808 84th Ave NE
- 14401 82nd Ave NE
- 8403 NE 138th St
- 14265 92nd Place NE
- 14265 92nd Place NE
- 14273 92nd Place NE
- 9205 NE 143rd Place
- 9211 NE 143rd Place
- 9211 NE 143rd Place
- 14259 92nd Place NE
- 14277 92nd Place NE
- 14274 92nd Place NE
- 14274 92nd Place NE
- 14252 92nd Ave NE
- 14266 92nd Place NE
- 14266 92nd Place NE
- 9235 NE 143rd Place
- 14258 92nd Ave NE
- 9217 NE 143rd Place
- 14260 92nd Place NE
- 14253 92nd Place NE
- 14246 92nd Ave NE
- 14305 93rd Ave NE
Your Personal Tour Guide
Ask me questions while you tour the home.