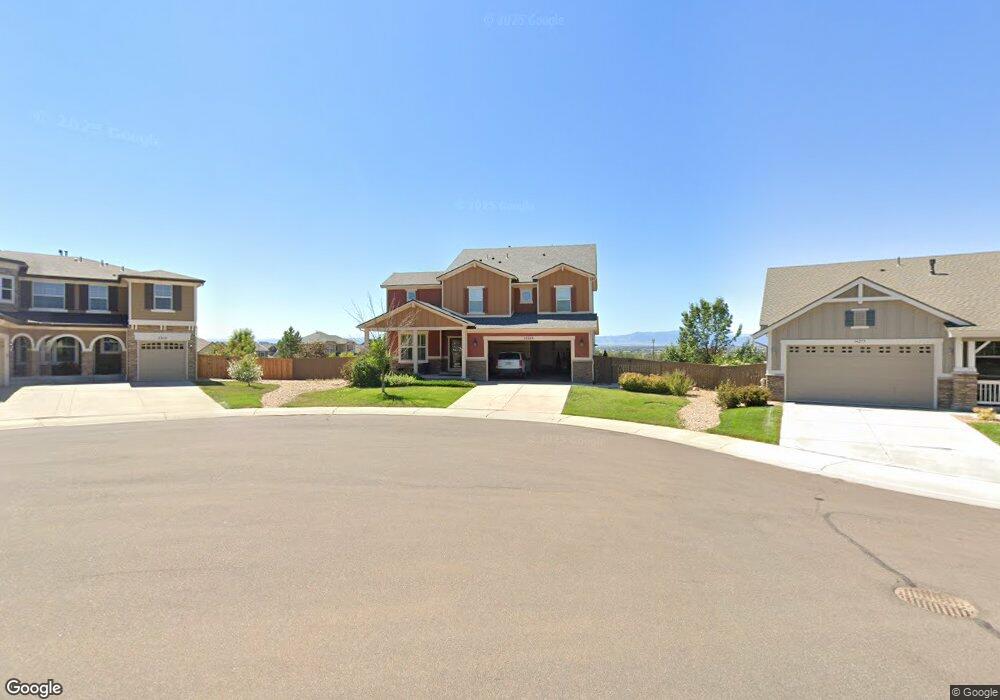
14269 Fillmore St Thornton, CO 80602
Fallbrook Farms NeighborhoodEstimated Value: $798,000 - $861,000
6
Beds
4
Baths
4,762
Sq Ft
$173/Sq Ft
Est. Value
About This Home
This home is located at 14269 Fillmore St, Thornton, CO 80602 and is currently estimated at $824,483, approximately $173 per square foot. 14269 Fillmore St is a home located in Adams County with nearby schools including Prairie Hills Elementary School, Rocky Top Middle School, and Horizon High School.
Ownership History
Date
Name
Owned For
Owner Type
Purchase Details
Closed on
Jan 2, 2020
Sold by
Martinez Ivan Richard and Martinez Ivan R
Bought by
The Martinez Family Trust
Current Estimated Value
Purchase Details
Closed on
May 16, 2017
Sold by
Bursey Vincent and Bursey Sherry
Bought by
Martinez Ivan Richard and Martinez Debra M
Home Financials for this Owner
Home Financials are based on the most recent Mortgage that was taken out on this home.
Original Mortgage
$300,000
Outstanding Balance
$245,444
Interest Rate
3.87%
Mortgage Type
Adjustable Rate Mortgage/ARM
Estimated Equity
$579,039
Purchase Details
Closed on
May 31, 2007
Sold by
Meritage Homes Of Colorado Inc
Bought by
Bursey Vincent and Bursey Sherry
Home Financials for this Owner
Home Financials are based on the most recent Mortgage that was taken out on this home.
Original Mortgage
$41,150
Interest Rate
6.15%
Mortgage Type
Stand Alone Second
Create a Home Valuation Report for This Property
The Home Valuation Report is an in-depth analysis detailing your home's value as well as a comparison with similar homes in the area
Home Values in the Area
Average Home Value in this Area
Purchase History
| Date | Buyer | Sale Price | Title Company |
|---|---|---|---|
| The Martinez Family Trust | -- | None Available | |
| Martinez Ivan Richard | $550,000 | Land Title Guarantee Co | |
| Bursey Vincent | $411,867 | Security Title |
Source: Public Records
Mortgage History
| Date | Status | Borrower | Loan Amount |
|---|---|---|---|
| Open | Martinez Ivan Richard | $300,000 | |
| Previous Owner | Bursey Vincent | $41,150 | |
| Previous Owner | Bursey Vincent | $329,450 |
Source: Public Records
Tax History
| Year | Tax Paid | Tax Assessment Tax Assessment Total Assessment is a certain percentage of the fair market value that is determined by local assessors to be the total taxable value of land and additions on the property. | Land | Improvement |
|---|---|---|---|---|
| 2025 | $5,351 | $54,340 | $8,300 | $46,040 |
| 2024 | $5,351 | $49,940 | $7,630 | $42,310 |
| 2023 | $5,296 | $55,400 | $8,250 | $47,150 |
| 2022 | $5,234 | $41,050 | $8,480 | $32,570 |
| 2021 | $6,460 | $41,050 | $8,480 | $32,570 |
| 2020 | $6,516 | $42,340 | $8,720 | $33,620 |
| 2019 | $6,525 | $42,340 | $8,720 | $33,620 |
| 2018 | $6,022 | $38,260 | $7,920 | $30,340 |
| 2017 | $5,623 | $38,260 | $7,920 | $30,340 |
| 2016 | $4,668 | $31,080 | $5,570 | $25,510 |
| 2015 | $4,671 | $31,080 | $5,570 | $25,510 |
| 2014 | -- | $27,900 | $4,940 | $22,960 |
Source: Public Records
Map
Nearby Homes
- 3067 E 143rd Ave
- 3347 E 142nd Dr
- 14057 Fillmore Dr
- 14447 Madison St
- 13963 Cook St
- 3592 E 141st Place
- 3593 E 141st Place
- 13904 Cook St
- 13845 Adams Cir
- 2084 E 143rd Ave
- 2705 E 148th Dr
- 1981 E 141st Ave
- 14628 Vine St
- 1936 E 144th Dr
- 14749 Gaylord St
- 14776 Race St
- 13638 Garfield St Unit C
- 4225 E 145 Ave
- 13604 Garfield St Unit E
- 14948 Gaylord St
- 14279 Fillmore St
- 2910 E 142nd Dr
- 14289 Fillmore St
- 2950 E 142nd Dr
- 14299 Fillmore St
- 2911 E 142nd Dr
- 2990 E 142nd Dr
- 2908 E 143rd Ave
- 14309 Fillmore St
- 2981 E 142nd Dr
- 2828 E 142nd Place
- 2808 E 142nd Place
- 2978 E 143rd Ave
- 2848 E 142nd Place
- 3016 E 142nd Dr
- 2868 E 142nd Place
- 2688 E 142nd Place
- 3008 E 143rd Ave
- 3025 E 142nd Dr
- 14319 Fillmore St
Your Personal Tour Guide
Ask me questions while you tour the home.