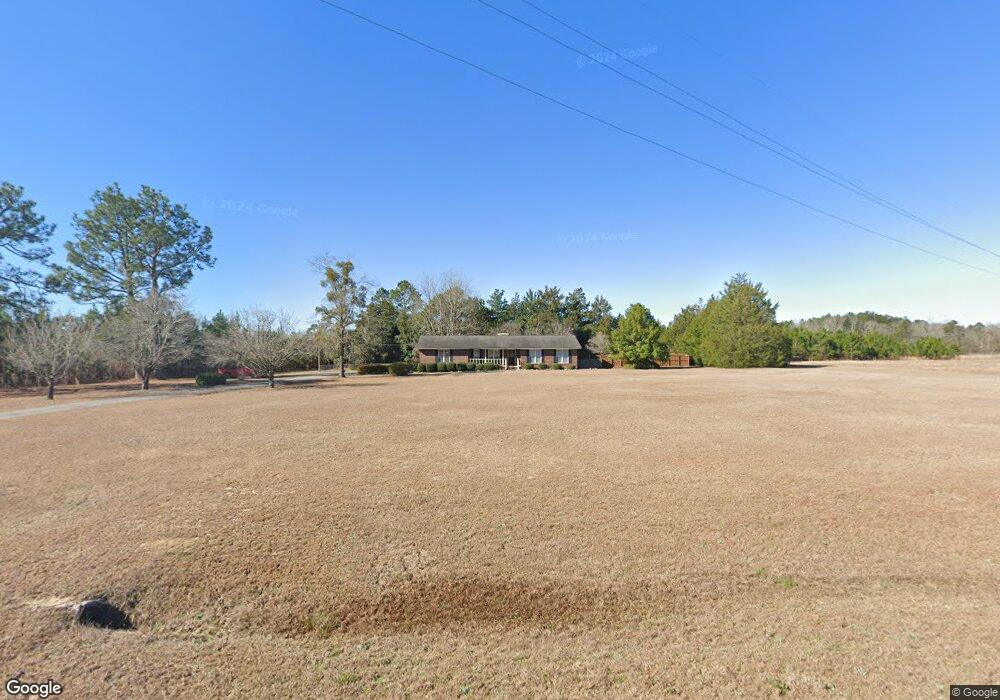
1427 Minter Tweed Rd East Dublin, GA 31027
Estimated Value: $185,592 - $326,000
--
Bed
4
Baths
2,519
Sq Ft
$104/Sq Ft
Est. Value
About This Home
This home is located at 1427 Minter Tweed Rd, East Dublin, GA 31027 and is currently estimated at $261,148, approximately $103 per square foot. 1427 Minter Tweed Rd is a home located in Laurens County with nearby schools including Southwest Laurens Elementary School, Northwest Laurens Elementary School, and East Laurens Primary School.
Ownership History
Date
Name
Owned For
Owner Type
Purchase Details
Closed on
Nov 20, 2006
Sold by
Anderson Pamela Jane Loyd
Bought by
Toler Kelly Wayne
Current Estimated Value
Home Financials for this Owner
Home Financials are based on the most recent Mortgage that was taken out on this home.
Original Mortgage
$128,000
Outstanding Balance
$76,223
Interest Rate
6.33%
Mortgage Type
New Conventional
Estimated Equity
$184,925
Purchase Details
Closed on
Nov 15, 2006
Sold by
Anderson Johnny Owen
Bought by
Young Terri L
Home Financials for this Owner
Home Financials are based on the most recent Mortgage that was taken out on this home.
Original Mortgage
$128,000
Outstanding Balance
$76,223
Interest Rate
6.33%
Mortgage Type
New Conventional
Estimated Equity
$184,925
Purchase Details
Closed on
Apr 20, 2004
Sold by
Toler Pamela
Bought by
Anderson Johnny and Anderson Pamela
Purchase Details
Closed on
Nov 30, 1983
Bought by
Toler Pamela
Create a Home Valuation Report for This Property
The Home Valuation Report is an in-depth analysis detailing your home's value as well as a comparison with similar homes in the area
Home Values in the Area
Average Home Value in this Area
Purchase History
| Date | Buyer | Sale Price | Title Company |
|---|---|---|---|
| Toler Kelly Wayne | -- | -- | |
| Young Terri L | $160,000 | -- | |
| Anderson Johnny | -- | -- | |
| Toler Pamela | -- | -- |
Source: Public Records
Mortgage History
| Date | Status | Borrower | Loan Amount |
|---|---|---|---|
| Open | Young Terri L | $128,000 |
Source: Public Records
Tax History Compared to Growth
Tax History
| Year | Tax Paid | Tax Assessment Tax Assessment Total Assessment is a certain percentage of the fair market value that is determined by local assessors to be the total taxable value of land and additions on the property. | Land | Improvement |
|---|---|---|---|---|
| 2024 | $1,186 | $56,343 | $4,622 | $51,721 |
| 2023 | $1,130 | $53,206 | $4,622 | $48,584 |
| 2022 | $1,135 | $53,071 | $4,487 | $48,584 |
| 2021 | $1,226 | $55,946 | $4,686 | $51,260 |
| 2020 | $1,227 | $55,946 | $4,686 | $51,260 |
| 2019 | $1,228 | $55,946 | $4,686 | $51,260 |
| 2018 | $1,230 | $55,946 | $4,686 | $51,260 |
| 2017 | $1,229 | $55,946 | $4,686 | $51,260 |
| 2016 | $1,230 | $55,946 | $4,686 | $51,260 |
| 2015 | $1,231 | $55,946 | $4,686 | $51,260 |
| 2014 | $1,128 | $50,063 | $5,908 | $44,155 |
Source: Public Records
Map
Nearby Homes
- 843 Daniel Mimbs Rd
- 984 Bush Rd
- 1005 Pleasant Springs Church Rd
- 859 Silver Rd
- 0 Raymond Wilkes Rd
- 1613 Georgia 29
- 437 Mccord Rd
- 461 Mccord Rd
- 0 Ralph Keen Rd Unit 21905127
- 1345 Georgia 199
- NA Rd
- 0 Lake Helen Loop Unit 10640271
- 644 Blue Jay Dr
- 1030 Grey Wolf Trail
- 907 Orianna Rd
- 532 Ned Collins Rd
- 0 Grey Wolf Trail Unit LOT 144 20128150
- 0 Grey Wolf Trail Unit LOT 151 20128152
- 0 Grey Wolf Trail Unit 25895
- 0 Grey Wolf Trail Unit 25897
- 1401 Minter Tweed Rd
- 1389 Minter Tweed Rd
- 1380 Minter Tweed Rd
- 1375 Minter Tweed Rd
- 1375 Minter Tweed Rd
- 1335 Minter Tweed Rd
- 1311 Minter Tweed Rd
- 1530 Minter Blue Springs Rd
- 866 Alvin Johnson Rd
- 1072 Lloyd Hester Rd
- 989 Lloyd Hester Rd
- 875 Alvin Johnson Rd
- 1556 Minter Tweed Rd
- 1292 Minter Tweed Rd
- 1032 Bush Rd
- 841 Alvin Johnson Rd
- 871 Lloyd Hester Rd
- 844 Alvin Johnson Rd
- 1011 Lloyd Hester Rd
- 863 Lloyd Hester Rd