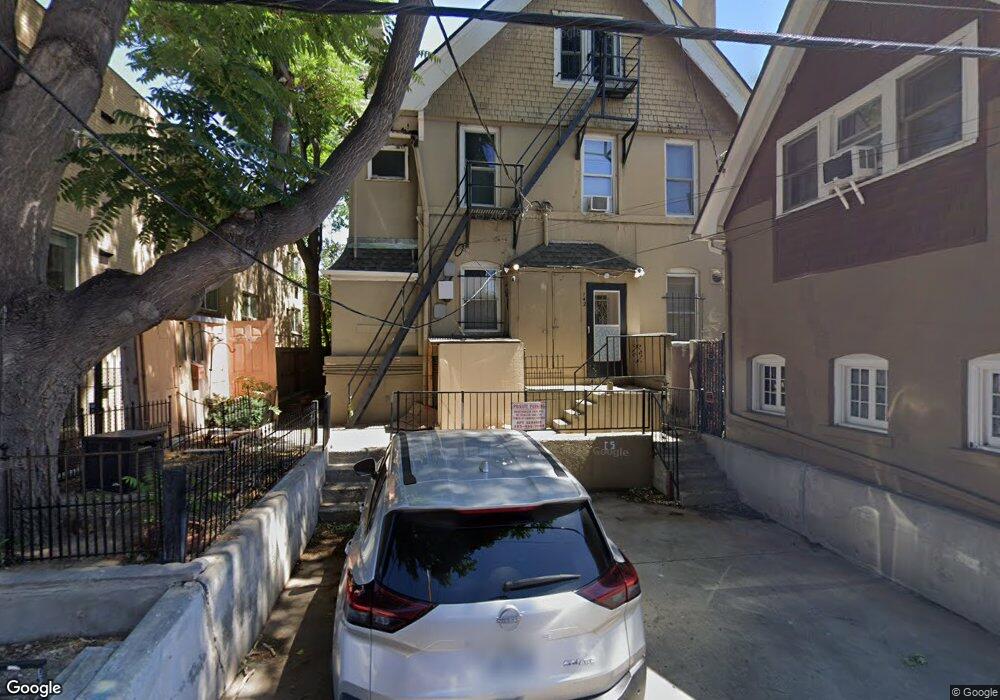
1427 N Franklin St Unit 3 Denver, CO 80218
Cheesman Park NeighborhoodEstimated Value: $223,000 - $298,000
1
Bed
1
Bath
481
Sq Ft
$534/Sq Ft
Est. Value
About This Home
This home is located at 1427 N Franklin St Unit 3, Denver, CO 80218 and is currently estimated at $256,934, approximately $534 per square foot. 1427 N Franklin St Unit 3 is a home located in Denver County with nearby schools including Dora Moore ECE-8 School, Morey Middle School, and East High School.
Ownership History
Date
Name
Owned For
Owner Type
Purchase Details
Closed on
Mar 11, 2022
Sold by
Catherine Fern
Bought by
Otten Betsy
Current Estimated Value
Home Financials for this Owner
Home Financials are based on the most recent Mortgage that was taken out on this home.
Original Mortgage
$252,200
Outstanding Balance
$237,729
Interest Rate
3.92%
Mortgage Type
New Conventional
Estimated Equity
$13,425
Purchase Details
Closed on
May 26, 2020
Sold by
Schwartz Melissa R and Estate Of Daniel Steven Bank
Bought by
Ferr Catherine
Home Financials for this Owner
Home Financials are based on the most recent Mortgage that was taken out on this home.
Original Mortgage
$132,930
Interest Rate
3.3%
Mortgage Type
New Conventional
Create a Home Valuation Report for This Property
The Home Valuation Report is an in-depth analysis detailing your home's value as well as a comparison with similar homes in the area
Home Values in the Area
Average Home Value in this Area
Purchase History
| Date | Buyer | Sale Price | Title Company |
|---|---|---|---|
| Otten Betsy | $260,000 | First American Title | |
| Ferr Catherine | $189,950 | Ascendant Title Co |
Source: Public Records
Mortgage History
| Date | Status | Borrower | Loan Amount |
|---|---|---|---|
| Open | Otten Betsy | $252,200 | |
| Previous Owner | Fern Catherine | $174,750 | |
| Previous Owner | Fern Catherine | $146,250 | |
| Previous Owner | Ferr Catherine | $132,930 | |
| Previous Owner | Bank Daniel S | $91,195 | |
| Previous Owner | Bank Daniel S | $99,618 | |
| Previous Owner | Bank Daniel S | $91,000 | |
| Previous Owner | Bank Daniel S | $60,500 | |
| Previous Owner | Bank Daniel S | $48,000 |
Source: Public Records
Tax History Compared to Growth
Tax History
| Year | Tax Paid | Tax Assessment Tax Assessment Total Assessment is a certain percentage of the fair market value that is determined by local assessors to be the total taxable value of land and additions on the property. | Land | Improvement |
|---|---|---|---|---|
| 2024 | $1,125 | $14,210 | $1,860 | $12,350 |
| 2023 | $1,101 | $14,210 | $1,860 | $12,350 |
| 2022 | $1,081 | $13,590 | $1,930 | $11,660 |
| 2021 | $1,043 | $13,980 | $1,980 | $12,000 |
| 2020 | $1,017 | $13,710 | $1,650 | $12,060 |
| 2019 | $989 | $13,710 | $1,650 | $12,060 |
| 2018 | $838 | $10,830 | $1,500 | $9,330 |
| 2017 | $835 | $10,830 | $1,500 | $9,330 |
| 2016 | $658 | $8,070 | $1,377 | $6,693 |
| 2015 | $630 | $8,070 | $1,377 | $6,693 |
| 2014 | $633 | $7,620 | $1,672 | $5,948 |
Source: Public Records
Map
Nearby Homes
- 1401 N Franklin St Unit 1
- 1438 Franklin St Unit 100
- 1355 Franklin St Unit 5
- 1351 Franklin St
- 1451 Gilpin St
- 1441 N Humboldt St Unit 507
- 1441 N Humboldt St Unit 204
- 1441 N Humboldt St Unit 504
- 1345 Franklin St
- 1475 N Humboldt St Unit 20
- 1337 N Humboldt St
- 1327 N Humboldt St
- 1375 N Williams St Unit 206
- 1275 Franklin St
- 1313 N Williams St Unit 1602
- 1313 N Williams St Unit 301
- 1313 N Williams St Unit 703
- 1210 E Colfax Ave Unit 302
- 1210 E Colfax Ave Unit 104
- 1210 E Colfax Ave Unit 301
- 1427 N Franklin St Unit 5
- 1427 N Franklin St Unit 6
- 1427 N Franklin St Unit 4
- 1427 N Franklin St Unit 1
- 1427 Franklin St Unit 6
- 1427 Franklin St Unit C5
- 1427 Franklin St
- 1427 Franklin St
- 1427 Franklin St Unit C2
- 1427 Franklin St
- 1427 Franklin St Unit 1
- 1427 Franklin St Unit 5
- 1427 Franklin St Unit 4
- 1419 Franklin St
- 1415 N Franklin St Unit B-5
- 1415 N Franklin St Unit 7
- 1415 N Franklin St Unit 2
- 1415 N Franklin St Unit B-1
- 1427 N Franklin St Unit 1
- 1427 N Franklin St Unit 3