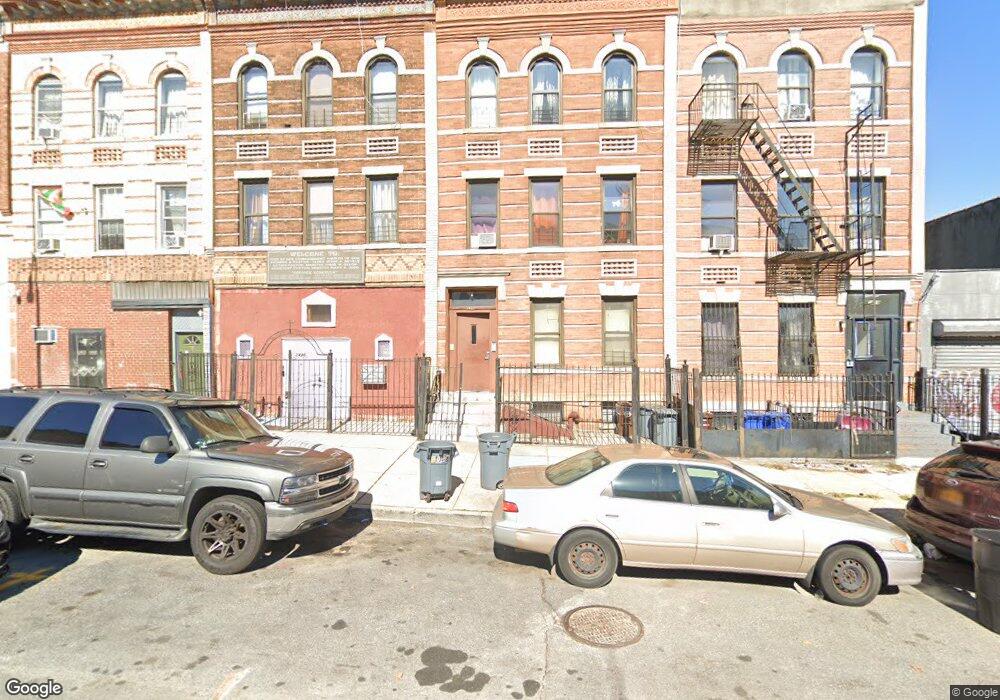
1427 Pitkin Ave Unit 2 Brooklyn, NY 11233
Crown Heights NeighborhoodEstimated Value: $943,861 - $1,255,000
3
Beds
1
Bath
2,724
Sq Ft
$390/Sq Ft
Est. Value
About This Home
This home is located at 1427 Pitkin Ave Unit 2, Brooklyn, NY 11233 and is currently estimated at $1,062,965, approximately $390 per square foot. 1427 Pitkin Ave Unit 2 is a home located in Kings County with nearby schools including P.S. 189 Lincoln Terrace, New Heights Middle School, and Brownsville Ascend Charter School.
Ownership History
Date
Name
Owned For
Owner Type
Purchase Details
Closed on
Aug 13, 2024
Sold by
Walker Michele
Bought by
Dim Joseph
Current Estimated Value
Home Financials for this Owner
Home Financials are based on the most recent Mortgage that was taken out on this home.
Original Mortgage
$878,750
Outstanding Balance
$867,385
Interest Rate
6.95%
Mortgage Type
Purchase Money Mortgage
Estimated Equity
$195,580
Purchase Details
Closed on
Jan 31, 2005
Sold by
Stewart Una B and Stewart Winston J
Bought by
Walker Michele
Home Financials for this Owner
Home Financials are based on the most recent Mortgage that was taken out on this home.
Original Mortgage
$21,750
Interest Rate
5.83%
Purchase Details
Closed on
Dec 18, 1995
Sold by
Isaacs Myrtle
Bought by
Stewart Winston J and Stewart Una B
Home Financials for this Owner
Home Financials are based on the most recent Mortgage that was taken out on this home.
Original Mortgage
$108,000
Interest Rate
7.31%
Create a Home Valuation Report for This Property
The Home Valuation Report is an in-depth analysis detailing your home's value as well as a comparison with similar homes in the area
Home Values in the Area
Average Home Value in this Area
Purchase History
| Date | Buyer | Sale Price | Title Company |
|---|---|---|---|
| Dim Joseph | $925,000 | -- | |
| Dim Joseph | $925,000 | -- | |
| Walker Michele | $435,000 | -- | |
| Walker Michele | $435,000 | -- | |
| Stewart Winston J | $120,000 | First American Title Ins Co | |
| Stewart Winston J | $120,000 | First American Title Ins Co |
Source: Public Records
Mortgage History
| Date | Status | Borrower | Loan Amount |
|---|---|---|---|
| Open | Dim Joseph | $878,750 | |
| Closed | Dim Joseph | $878,750 | |
| Previous Owner | Walker Michele | $21,750 | |
| Previous Owner | Walker Michele | $391,500 | |
| Previous Owner | Stewart Winston J | $108,000 |
Source: Public Records
Tax History
| Year | Tax Paid | Tax Assessment Tax Assessment Total Assessment is a certain percentage of the fair market value that is determined by local assessors to be the total taxable value of land and additions on the property. | Land | Improvement |
|---|---|---|---|---|
| 2025 | $2,106 | $75,720 | $18,300 | $57,420 |
| 2024 | $2,106 | $60,060 | $18,300 | $41,760 |
| 2023 | $2,013 | $53,640 | $18,300 | $35,340 |
| 2022 | $1,872 | $55,680 | $18,300 | $37,380 |
| 2021 | $1,862 | $52,620 | $18,300 | $34,320 |
| 2020 | $910 | $51,840 | $18,300 | $33,540 |
| 2019 | $1,828 | $50,040 | $18,300 | $31,740 |
| 2018 | $1,684 | $8,262 | $3,652 | $4,610 |
| 2017 | $1,593 | $7,813 | $2,787 | $5,026 |
| 2016 | $1,474 | $7,372 | $3,552 | $3,820 |
| 2015 | $889 | $7,356 | $5,317 | $2,039 |
| 2014 | $889 | $7,282 | $5,878 | $1,404 |
Source: Public Records
Map
Nearby Homes
- 1655 Lincoln Place
- 31 Tapscott St
- 45 Legion St
- 1830 Sterling Place
- 1709 Park Place
- 2087 Union St
- 1887 Strauss St Unit HOUSE
- 589 Saratoga Ave
- 1526 Lincoln Place Unit 3-L
- 1526 Lincoln Place Unit 4-R
- 1526 Lincoln Place Unit 1-L
- 1526 Lincoln Place Unit 3-R
- 121 Legion St
- 96 Herzl St
- 476 Ralph Ave
- 2127 Union St
- 1578 Eastern Pkwy
- 1585 Pitkin Ave
- 1570 Prospect Place Unit 2
- 189 Buffalo Ave
- 1427 Pitkin Ave
- 1427 Pitkin Ave Unit 3
- 1425 Pitkin Ave
- 1429 Pitkin Ave
- 1421 Pitkin Ave
- 1441 Pitkin Ave
- 1419 Pitkin Ave
- 1443 Pitkin Ave
- 1417 Pitkin Ave
- 1445 Pitkin Ave
- 1424 Eastern Pkwy
- 1426 Eastern Pkwy
- 1430 Eastern Pkwy
- 1432 Eastern Pkwy
- 1415 Pitkin Ave
- 1434 Eastern Pkwy
- 1414 Pitkin Ave
- 556 Howard Ave
- 1418 Eastern Pkwy
- 1453 Pitkin Ave
Your Personal Tour Guide
Ask me questions while you tour the home.