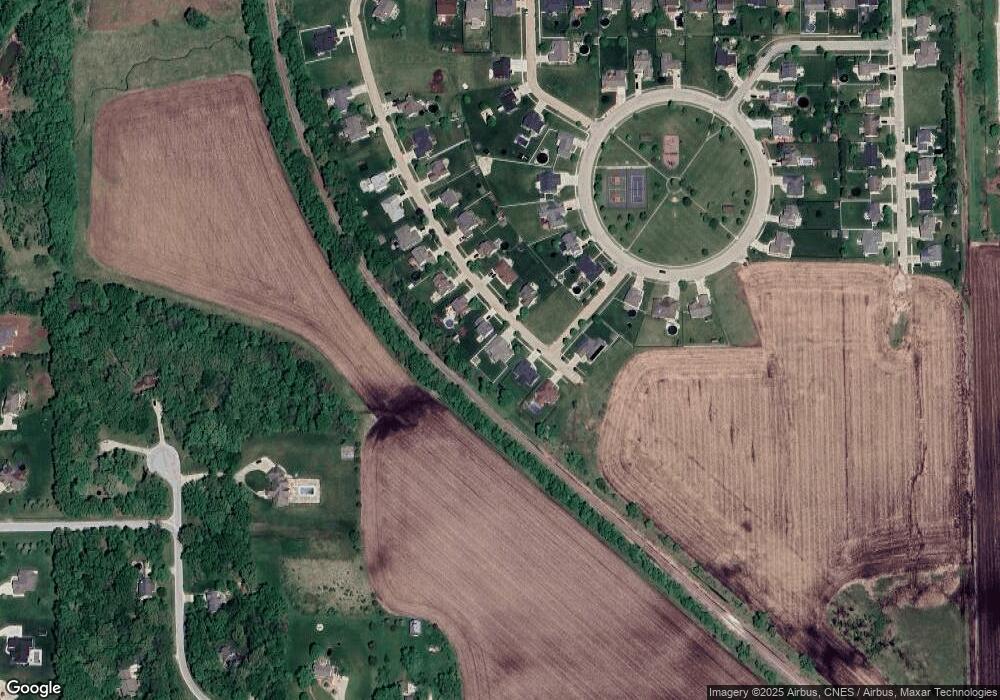
1427 Shaws Ln Ottawa, IL 61350
Estimated Value: $384,943 - $441,000
3
Beds
3
Baths
2,044
Sq Ft
$202/Sq Ft
Est. Value
About This Home
This home is located at 1427 Shaws Ln, Ottawa, IL 61350 and is currently estimated at $412,236, approximately $201 per square foot. 1427 Shaws Ln is a home located in LaSalle County with nearby schools including Ottawa Township High School and Ottawa Christian Academy.
Ownership History
Date
Name
Owned For
Owner Type
Purchase Details
Closed on
Apr 17, 2012
Sold by
Cinquegrani Caroline E
Bought by
Holloway Ryan M and Holloway Katheryn S
Current Estimated Value
Home Financials for this Owner
Home Financials are based on the most recent Mortgage that was taken out on this home.
Original Mortgage
$204,000
Outstanding Balance
$140,839
Interest Rate
3.9%
Mortgage Type
New Conventional
Estimated Equity
$271,398
Purchase Details
Closed on
Oct 15, 2008
Sold by
Eplin Delbert
Bought by
Cinquegrani Caroline E
Home Financials for this Owner
Home Financials are based on the most recent Mortgage that was taken out on this home.
Original Mortgage
$223,800
Interest Rate
6.41%
Mortgage Type
New Conventional
Purchase Details
Closed on
Jun 24, 2008
Sold by
Union Bank
Bought by
Eplin Delbert
Home Financials for this Owner
Home Financials are based on the most recent Mortgage that was taken out on this home.
Original Mortgage
$39,900
Interest Rate
6.05%
Mortgage Type
Purchase Money Mortgage
Create a Home Valuation Report for This Property
The Home Valuation Report is an in-depth analysis detailing your home's value as well as a comparison with similar homes in the area
Home Values in the Area
Average Home Value in this Area
Purchase History
| Date | Buyer | Sale Price | Title Company |
|---|---|---|---|
| Holloway Ryan M | $255,000 | None Available | |
| Cinquegrani Caroline E | $279,750 | None Available | |
| Eplin Delbert | $41,900 | None Available |
Source: Public Records
Mortgage History
| Date | Status | Borrower | Loan Amount |
|---|---|---|---|
| Open | Holloway Ryan M | $204,000 | |
| Previous Owner | Cinquegrani Caroline E | $223,800 | |
| Previous Owner | Eplin Delbert | $39,900 |
Source: Public Records
Tax History Compared to Growth
Tax History
| Year | Tax Paid | Tax Assessment Tax Assessment Total Assessment is a certain percentage of the fair market value that is determined by local assessors to be the total taxable value of land and additions on the property. | Land | Improvement |
|---|---|---|---|---|
| 2024 | $11,405 | $116,333 | $15,772 | $100,561 |
| 2023 | $10,666 | $106,982 | $14,504 | $92,478 |
| 2022 | $9,804 | $97,674 | $14,271 | $83,403 |
| 2021 | $9,210 | $91,575 | $13,380 | $78,195 |
| 2020 | $8,705 | $87,314 | $12,757 | $74,557 |
| 2019 | $8,708 | $84,688 | $12,373 | $72,315 |
| 2018 | $8,461 | $82,526 | $12,057 | $70,469 |
| 2017 | $8,230 | $80,734 | $11,795 | $68,939 |
| 2016 | $7,941 | $77,853 | $11,374 | $66,479 |
| 2015 | $3,959 | $77,853 | $10,885 | $66,968 |
| 2012 | -- | $79,371 | $11,097 | $68,274 |
Source: Public Records
Map
Nearby Homes