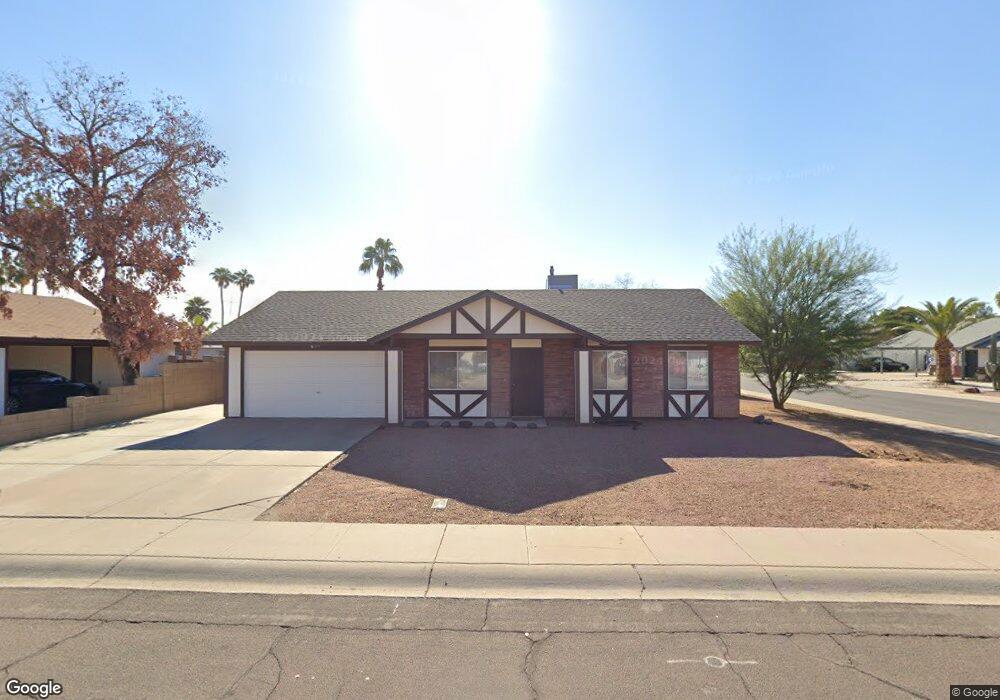
1427 W Chilton St Chandler, AZ 85224
Amberwood NeighborhoodEstimated Value: $403,590 - $508,000
--
Bed
2
Baths
1,845
Sq Ft
$251/Sq Ft
Est. Value
About This Home
This home is located at 1427 W Chilton St, Chandler, AZ 85224 and is currently estimated at $463,648, approximately $251 per square foot. 1427 W Chilton St is a home located in Maricopa County with nearby schools including Franklin at Brimhall Elementary School, Summit Academy Elementary, and Franklin Accelerated Academy Jordan Campus.
Ownership History
Date
Name
Owned For
Owner Type
Purchase Details
Closed on
Aug 6, 2022
Sold by
Depler Maryann
Bought by
Depler Maryann and Depler Jay
Current Estimated Value
Purchase Details
Closed on
Dec 17, 2014
Sold by
Depler David
Bought by
Depler Mary Ann
Purchase Details
Closed on
Apr 19, 2004
Sold by
Providence Richard E
Bought by
Depler David F and Depler Maryann
Home Financials for this Owner
Home Financials are based on the most recent Mortgage that was taken out on this home.
Original Mortgage
$140,000
Interest Rate
5.77%
Mortgage Type
New Conventional
Purchase Details
Closed on
Sep 30, 2003
Sold by
Providence Richard E
Bought by
Providence Richard E
Create a Home Valuation Report for This Property
The Home Valuation Report is an in-depth analysis detailing your home's value as well as a comparison with similar homes in the area
Home Values in the Area
Average Home Value in this Area
Purchase History
| Date | Buyer | Sale Price | Title Company |
|---|---|---|---|
| Depler Maryann | -- | None Listed On Document | |
| Depler Mary Ann | -- | None Available | |
| Depler David F | $175,000 | First American Title Ins Co | |
| Providence Richard E | -- | -- |
Source: Public Records
Mortgage History
| Date | Status | Borrower | Loan Amount |
|---|---|---|---|
| Previous Owner | Depler David F | $140,000 | |
| Closed | Depler David F | $35,000 |
Source: Public Records
Tax History Compared to Growth
Tax History
| Year | Tax Paid | Tax Assessment Tax Assessment Total Assessment is a certain percentage of the fair market value that is determined by local assessors to be the total taxable value of land and additions on the property. | Land | Improvement |
|---|---|---|---|---|
| 2025 | $1,613 | $18,908 | -- | -- |
| 2024 | $1,628 | $18,008 | -- | -- |
| 2023 | $1,628 | $35,780 | $7,150 | $28,630 |
| 2022 | $1,583 | $26,700 | $5,340 | $21,360 |
| 2021 | $1,592 | $24,870 | $4,970 | $19,900 |
| 2020 | $1,574 | $22,980 | $4,590 | $18,390 |
| 2019 | $1,450 | $21,220 | $4,240 | $16,980 |
| 2018 | $1,408 | $19,550 | $3,910 | $15,640 |
| 2017 | $1,354 | $18,200 | $3,640 | $14,560 |
| 2016 | $1,324 | $17,680 | $3,530 | $14,150 |
| 2015 | $1,246 | $15,680 | $3,130 | $12,550 |
Source: Public Records
Map
Nearby Homes
- 1309 W Marlboro Dr
- 1203 W Alamo Dr
- 1126 W Elliot Rd Unit 1040
- 1126 W Elliot Rd Unit 1010
- 1805 W Cheyenne Dr
- 1807 W Mission Dr
- 1800 W Rosewood Ct
- 898 W Sterling Place
- 3009 N Pleasant Dr
- 2615 N Yucca St
- 1821 W Mission Dr
- 1224 W Mesquite St
- 1337 W Pampa Ave
- 916 W Loughlin Dr
- 2609 N Pleasant Dr
- 1511 W Mesquite St
- 2014 W Summit Place
- 1351 W Plata Ave
- 3030 S Alma School Rd Unit 12
- 3030 S Alma School Rd Unit 10
- 1423 W Chilton St
- 3014 N Arrowhead Dr
- 1419 W Chilton St
- 1419 W Chilton St
- 3019 N Arrowhead Dr
- 3023 N Arrowhead Dr
- 3010 N Arrowhead Dr Unit 1
- 1432 W Chilton St
- 1502 W Chilton St
- 3012 N Sean Ct
- 1428 W Chilton St Unit 1
- 3015 N Arrowhead Dr
- 1415 W Chilton St
- 1424 W Chilton St
- 1506 W Chilton St
- 1515 W Chilton St
- 3018 N Sean Ct
- 3006 N Arrowhead Dr
- 3008 N Sean Ct
- 1420 W Chilton St