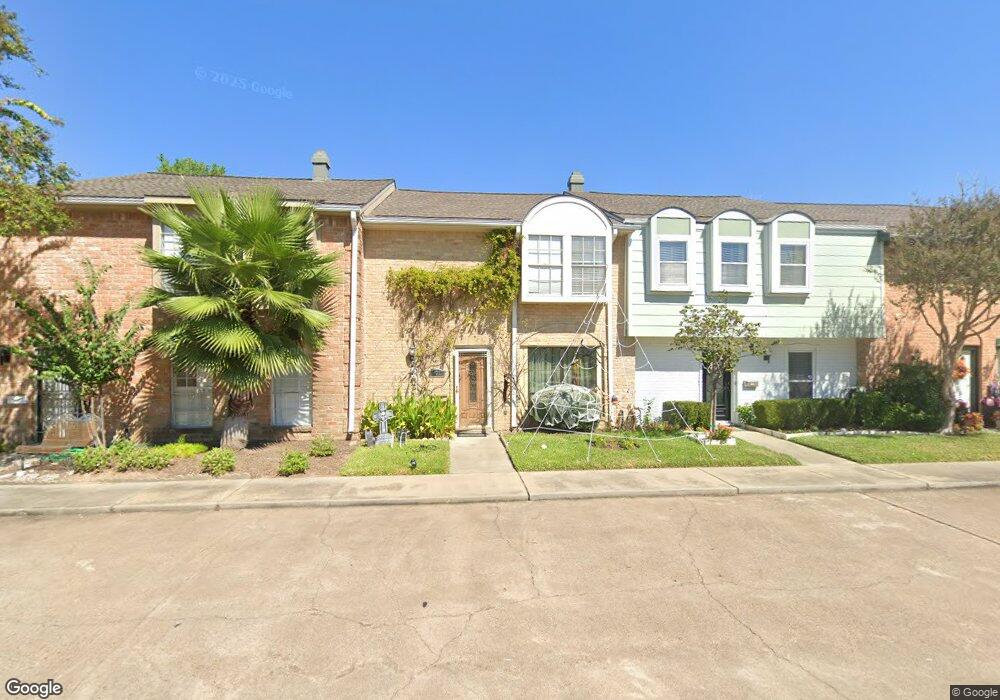
14277 Lost Meadow Ln Unit 14277 Houston, TX 77079
Energy Corridor NeighborhoodEstimated Value: $228,145 - $275,000
3
Beds
3
Baths
1,936
Sq Ft
$129/Sq Ft
Est. Value
About This Home
This home is located at 14277 Lost Meadow Ln Unit 14277, Houston, TX 77079 and is currently estimated at $250,536, approximately $129 per square foot. 14277 Lost Meadow Ln Unit 14277 is a home located in Harris County with nearby schools including Thornwood Elementary School, Spring Forest Middle School, and Stratford High School.
Ownership History
Date
Name
Owned For
Owner Type
Purchase Details
Closed on
May 25, 2006
Sold by
Hsbc Bank Usa Na
Bought by
Lahijani Hassan H
Current Estimated Value
Home Financials for this Owner
Home Financials are based on the most recent Mortgage that was taken out on this home.
Original Mortgage
$79,425
Outstanding Balance
$46,419
Interest Rate
6.56%
Mortgage Type
Purchase Money Mortgage
Estimated Equity
$204,117
Purchase Details
Closed on
Nov 1, 2005
Sold by
Nguyen Sonny T
Bought by
Hsbc Bank Usa Na and The Registered Holders Of Ace Securities
Purchase Details
Closed on
Aug 31, 2004
Sold by
Jayne Hudson
Bought by
Nguyen Sonny T
Home Financials for this Owner
Home Financials are based on the most recent Mortgage that was taken out on this home.
Original Mortgage
$102,400
Interest Rate
8.99%
Mortgage Type
Purchase Money Mortgage
Create a Home Valuation Report for This Property
The Home Valuation Report is an in-depth analysis detailing your home's value as well as a comparison with similar homes in the area
Home Values in the Area
Average Home Value in this Area
Purchase History
| Date | Buyer | Sale Price | Title Company |
|---|---|---|---|
| Lahijani Hassan H | -- | Fidelity National Title | |
| Hsbc Bank Usa Na | $106,950 | -- | |
| Nguyen Sonny T | -- | First American Title |
Source: Public Records
Mortgage History
| Date | Status | Borrower | Loan Amount |
|---|---|---|---|
| Open | Lahijani Hassan H | $79,425 | |
| Previous Owner | Nguyen Sonny T | $102,400 | |
| Closed | Nguyen Sonny T | $25,600 |
Source: Public Records
Tax History Compared to Growth
Tax History
| Year | Tax Paid | Tax Assessment Tax Assessment Total Assessment is a certain percentage of the fair market value that is determined by local assessors to be the total taxable value of land and additions on the property. | Land | Improvement |
|---|---|---|---|---|
| 2025 | $2,324 | $194,547 | $64,591 | $129,956 |
| 2024 | $2,324 | $192,852 | $64,591 | $128,261 |
| 2023 | $2,324 | $203,893 | $64,591 | $139,302 |
| 2022 | $3,729 | $163,207 | $64,591 | $98,616 |
| 2021 | $3,540 | $145,000 | $64,591 | $80,409 |
| 2020 | $3,632 | $144,964 | $64,591 | $80,373 |
| 2019 | $4,398 | $168,000 | $50,237 | $117,763 |
| 2018 | $1,738 | $177,604 | $50,237 | $127,367 |
| 2017 | $4,346 | $177,604 | $35,884 | $141,720 |
| 2016 | $3,951 | $177,604 | $35,884 | $141,720 |
| 2015 | $1,265 | $177,604 | $35,884 | $141,720 |
| 2014 | $1,265 | $147,230 | $28,707 | $118,523 |
Source: Public Records
Map
Nearby Homes
- 14228 Misty Meadow Ln
- 14143 Lost Meadow Ln
- 14226 Misty Meadow Ln
- 14151 Lost Meadow Ln
- 14213 Lost Meadow Ln
- 14325 Lost Meadow Ln
- 14123 Misty Meadow Ln
- 1334 Country Place Dr
- 14171 Misty Meadow Ln
- 14322 Misty Meadow Ln
- 14311 Misty Meadow Ln
- 1310 Country Place Dr
- 14387 Misty Meadow Ln
- 14122 Barryknoll Ln
- 14407 Still Meadow Dr
- 1381 Country Place Dr Unit 23
- 1147 Country Place Dr
- 1071 Country Place Dr Unit 1071
- 14435 Misty Meadow Ln
- 14507 Misty Meadow Ln
- 14277 Lost Meadow Ln
- 14279 Lost Meadow Ln
- 14275 Lost Meadow Ln
- 14281 Lost Meadow Ln
- 14283 Lost Meadow Ln
- 14283 Lost Meadow Ln Unit 14283
- 14285 Lost Meadow Ln
- 14287 Lost Meadow Ln
- 14271 Lost Meadow Ln
- 14269 Lost Meadow Ln
- 14273 Lost Meadow Ln
- 14331 Lost Meadow Ln
- 14267 Lost Meadow Ln
- 14289 Lost Meadow Ln
- 14327 Lost Meadow Ln
- 14265 Lost Meadow Ln
- 14323 Lost Meadow Ln
- 14263 Lost Meadow Ln
- 14232 Misty Meadow Ln
- 1364 Country Place Dr