Estimated Value: $517,000 - $540,000
3
Beds
3
Baths
1,675
Sq Ft
$316/Sq Ft
Est. Value
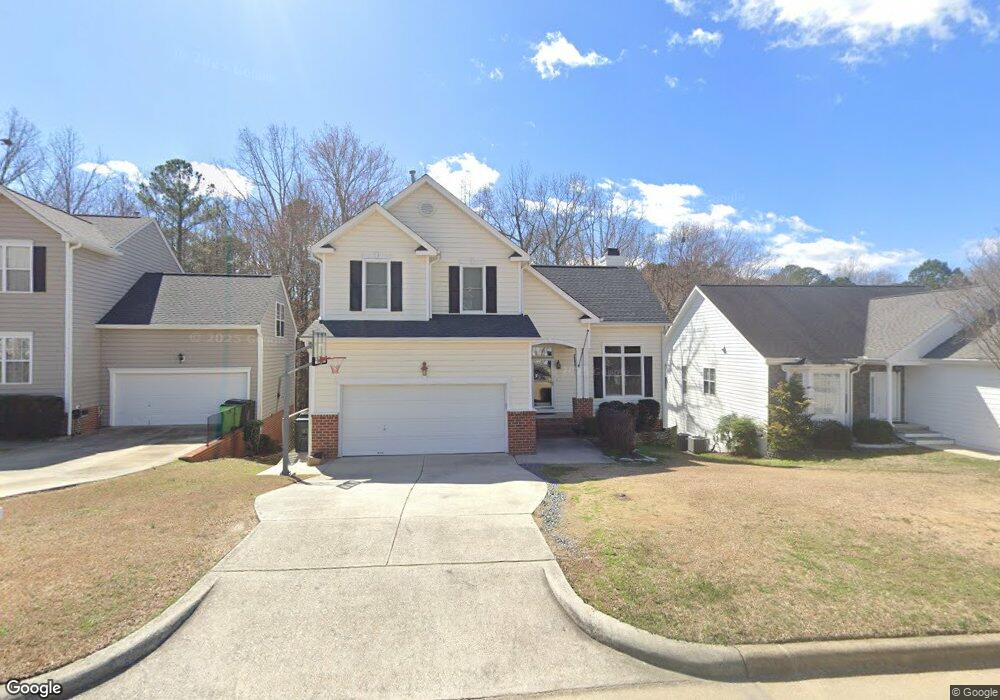
About This Home
This home is located at 1428 Big Leaf Loop, Apex, NC 27502 and is currently estimated at $529,629, approximately $316 per square foot. 1428 Big Leaf Loop is a home located in Wake County with nearby schools including Scotts Ridge Elementary School, Apex Middle, and Apex High School.
Ownership History
Date
Name
Owned For
Owner Type
Purchase Details
Closed on
Jun 14, 2001
Sold by
Gemmell Patrick A
Bought by
Hankins Tradd M and Hankins Carla C
Current Estimated Value
Home Financials for this Owner
Home Financials are based on the most recent Mortgage that was taken out on this home.
Original Mortgage
$136,000
Interest Rate
7.11%
Mortgage Type
Balloon
Purchase Details
Closed on
Jan 5, 1998
Sold by
Centex International Inc
Bought by
Gemmell Patrick A and Gemmell Connie F
Home Financials for this Owner
Home Financials are based on the most recent Mortgage that was taken out on this home.
Original Mortgage
$114,370
Interest Rate
6.25%
Create a Home Valuation Report for This Property
The Home Valuation Report is an in-depth analysis detailing your home's value as well as a comparison with similar homes in the area
Purchase History
| Date | Buyer | Sale Price | Title Company |
|---|---|---|---|
| Hankins Tradd M | $170,000 | -- | |
| Gemmell Patrick A | $163,500 | -- |
Source: Public Records
Mortgage History
| Date | Status | Borrower | Loan Amount |
|---|---|---|---|
| Closed | Hankins Tradd M | $136,000 | |
| Previous Owner | Gemmell Patrick A | $114,370 | |
| Closed | Hankins Tradd M | $25,500 |
Source: Public Records
Tax History
| Year | Tax Paid | Tax Assessment Tax Assessment Total Assessment is a certain percentage of the fair market value that is determined by local assessors to be the total taxable value of land and additions on the property. | Land | Improvement |
|---|---|---|---|---|
| 2025 | $4,461 | $508,634 | $190,000 | $318,634 |
| 2024 | $4,361 | $508,634 | $190,000 | $318,634 |
Source: Public Records
Map
Nearby Homes
- 1303 Goldspot Ct
- 402 Village Loop Dr
- 541 Village Loop Dr
- 1105 Capitata Crossing
- 1116 Silky Dogwood Trail
- 3021 White Cloud Cir
- 1773 Town Home Dr
- 0 Jb Morgan Rd Unit 10051948
- 301 Cameron Glen Dr
- 1002 Tribble Gate Ct
- 1880 Woodall Crest Dr
- 2113 Barrier Ridge Way
- 2117 Barrier Ridge Way
- 2115 Barrier Ridge Way
- 2119 Barrier Ridge Way
- 2112 Barrier Ridge Way
- 2118 Barrier Ridge Way
- 2122 Barrier Ridge Way
- 1110 Palisade Bluff Ln
- 1127 Palisade Bluff Ln
- 1426 Big Leaf Loop
- 1430 Big Leaf Loop
- 1424 Big Leaf Loop
- 1432 Big Leaf Loop
- 1429 Big Leaf Loop
- 1425 Big Leaf Loop
- 1422 Big Leaf Loop
- 1431 Big Leaf Loop
- 1434 Big Leaf Loop
- 1423 Big Leaf Loop
- 1435 Big Leaf Loop
- 1420 Big Leaf Loop
- 1410 Willowleaf Way
- 1410 Willow Leaf Way
- 1436 Big Leaf Loop
- 1412 Willow Leaf Way
- 506 Hickory View Ln
- 505 Hickory View Ln
- 1437 Big Leaf Loop
- 1408 Willow Leaf Way