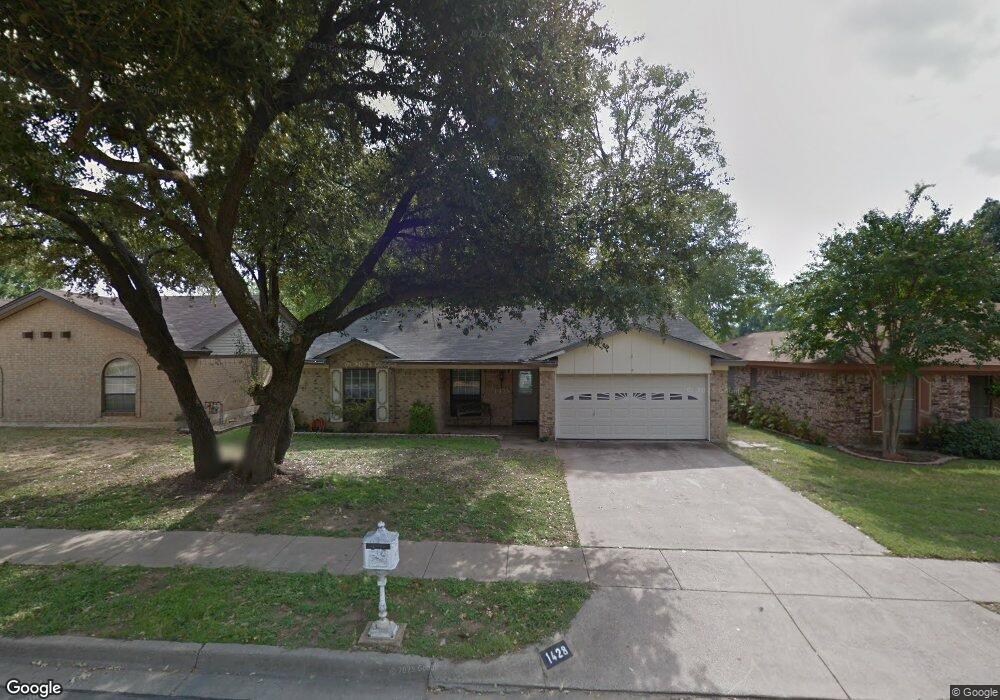
1428 Bryan Dr Bedford, TX 76022
Estimated Value: $317,606 - $350,000
3
Beds
2
Baths
1,503
Sq Ft
$218/Sq Ft
Est. Value
About This Home
This home is located at 1428 Bryan Dr, Bedford, TX 76022 and is currently estimated at $328,152, approximately $218 per square foot. 1428 Bryan Dr is a home located in Tarrant County with nearby schools including Bell Manor Elementary School, Central J High School, and Trinity High School.
Ownership History
Date
Name
Owned For
Owner Type
Purchase Details
Closed on
Jun 30, 2003
Sold by
Risinger Belinda I and Baggett Roger
Bought by
Hinnen Dean A and Hinnen Kathleen F
Current Estimated Value
Home Financials for this Owner
Home Financials are based on the most recent Mortgage that was taken out on this home.
Original Mortgage
$94,300
Interest Rate
5.27%
Mortgage Type
Purchase Money Mortgage
Purchase Details
Closed on
Dec 2, 1999
Sold by
Risinger Steve Allen
Bought by
Risinger Belinda Inez
Purchase Details
Closed on
Oct 8, 1998
Sold by
Eastup Pamela Edgington
Bought by
Risinger Steve A and Risinger Belinda J
Home Financials for this Owner
Home Financials are based on the most recent Mortgage that was taken out on this home.
Original Mortgage
$88,500
Interest Rate
6.5%
Mortgage Type
VA
Create a Home Valuation Report for This Property
The Home Valuation Report is an in-depth analysis detailing your home's value as well as a comparison with similar homes in the area
Home Values in the Area
Average Home Value in this Area
Purchase History
| Date | Buyer | Sale Price | Title Company |
|---|---|---|---|
| Hinnen Dean A | -- | Commerce Title Co | |
| Risinger Belinda Inez | -- | -- | |
| Risinger Steve A | -- | Alamo Title Co |
Source: Public Records
Mortgage History
| Date | Status | Borrower | Loan Amount |
|---|---|---|---|
| Closed | Hinnen Dean A | $94,300 | |
| Previous Owner | Risinger Steve A | $88,500 | |
| Closed | Risinger Belinda Inez | $0 |
Source: Public Records
Tax History Compared to Growth
Tax History
| Year | Tax Paid | Tax Assessment Tax Assessment Total Assessment is a certain percentage of the fair market value that is determined by local assessors to be the total taxable value of land and additions on the property. | Land | Improvement |
|---|---|---|---|---|
| 2025 | $962 | $297,950 | $65,000 | $232,950 |
| 2024 | $962 | $297,950 | $65,000 | $232,950 |
| 2023 | $5,049 | $280,030 | $45,000 | $235,030 |
| 2022 | $5,227 | $243,830 | $45,000 | $198,830 |
| 2021 | $5,125 | $217,547 | $45,000 | $172,547 |
| 2020 | $4,715 | $198,315 | $45,000 | $153,315 |
| 2019 | $4,623 | $200,071 | $45,000 | $155,071 |
| 2018 | $1,955 | $172,986 | $18,000 | $154,986 |
| 2017 | $3,980 | $164,502 | $18,000 | $146,502 |
| 2016 | $3,630 | $150,037 | $18,000 | $132,037 |
| 2015 | $1,999 | $140,249 | $18,000 | $122,249 |
| 2014 | $1,999 | $131,300 | $18,000 | $113,300 |
Source: Public Records
Map
Nearby Homes
- 1613 Trinity Ct
- 1701 Winchester Way
- 1031 Boston Blvd
- 1604 Richmond Dr
- 933 Charleston Ct
- 952 Charleston Dr
- 1004 Overhill Dr
- 921 Overhill Dr
- 909 Overhill Dr
- 804 Natchez Ave
- 1204 Edgecliff Dr
- 2024 Charleston Dr
- 1509 Shirley Way
- 2101 Gettysburg Place
- 2025 Schumac Ln
- 2201 Greendale Ct
- 1213 Briar Dr
- 1213 Greendale Dr
- 828 Gregory Ave
- 832 Chateau Valee Cir
- 1424 Bryan Dr
- 1432 Bryan Dr
- 1009 Monterrey St
- 936 Columbus Ct
- 932 Columbus Ct
- 1005 Monterrey St
- 928 Columbus Ct
- 1429 Bryan Dr
- 1433 Bryan Dr
- 1008 Monterrey St
- 1012 Monterrey St
- 1001 Monterrey St
- 924 Columbus Ct
- 1421 Bryan Dr
- 1004 Monterrey St
- 1016 Monterrey St
- 1417 Bryan Dr
- 920 Columbus Ct
- 1000 Monterrey St
- 917 Monterrey St