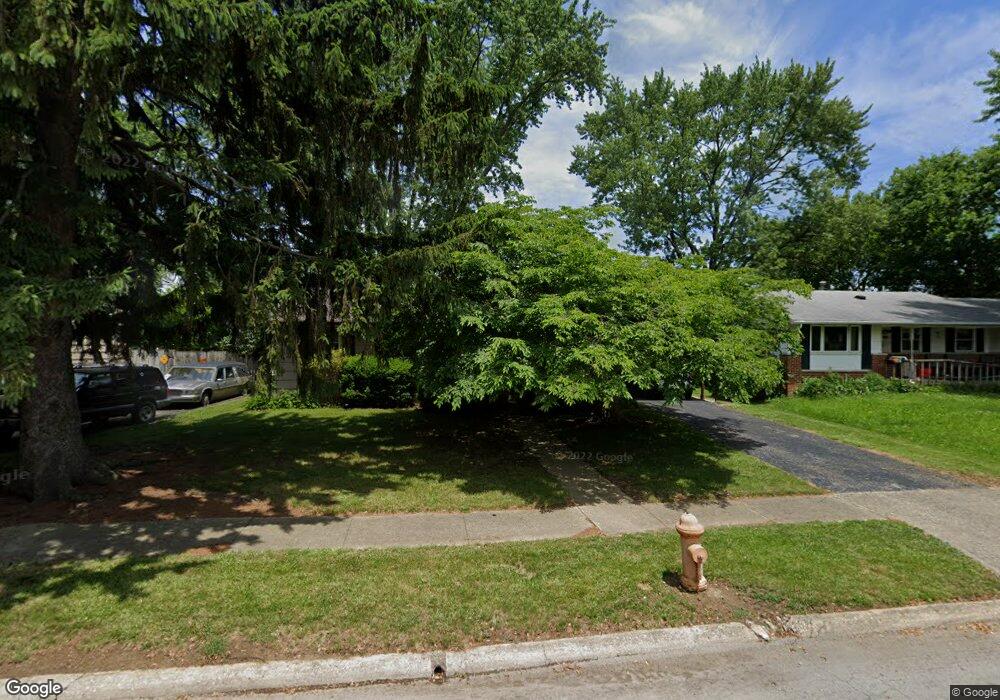
1428 Burnley Square N Columbus, OH 43229
Devonshire NeighborhoodEstimated Value: $236,000 - $327,781
3
Beds
2
Baths
1,212
Sq Ft
$231/Sq Ft
Est. Value
About This Home
This home is located at 1428 Burnley Square N, Columbus, OH 43229 and is currently estimated at $279,445, approximately $230 per square foot. 1428 Burnley Square N is a home located in Franklin County with nearby schools including Devonshire Alternative Elementary School, Woodward Park Middle School, and Beechcroft High School.
Ownership History
Date
Name
Owned For
Owner Type
Purchase Details
Closed on
Dec 7, 2021
Sold by
Arvm 5 Llc
Bought by
Amnl Asset Company 2 Llc
Current Estimated Value
Purchase Details
Closed on
Jul 9, 2021
Sold by
Janik Anna J and Durham Kelli A
Bought by
Arvm 5 Llc
Purchase Details
Closed on
Dec 22, 2015
Sold by
Swinehart Jerod A
Bought by
Janik Anna J and Durham Kelli A
Home Financials for this Owner
Home Financials are based on the most recent Mortgage that was taken out on this home.
Original Mortgage
$100,642
Interest Rate
3.87%
Mortgage Type
FHA
Purchase Details
Closed on
Aug 17, 2006
Sold by
Whittenburg Jacqueline A
Bought by
Swinehart Jerod A
Home Financials for this Owner
Home Financials are based on the most recent Mortgage that was taken out on this home.
Original Mortgage
$80,000
Interest Rate
6.78%
Mortgage Type
Purchase Money Mortgage
Purchase Details
Closed on
Oct 19, 1990
Bought by
Whittenburg Jacquelin A
Purchase Details
Closed on
Mar 27, 1990
Purchase Details
Closed on
Aug 1, 1985
Create a Home Valuation Report for This Property
The Home Valuation Report is an in-depth analysis detailing your home's value as well as a comparison with similar homes in the area
Home Values in the Area
Average Home Value in this Area
Purchase History
| Date | Buyer | Sale Price | Title Company |
|---|---|---|---|
| Amnl Asset Company 2 Llc | $299,400 | Bchh Title Inc | |
| Arvm 5 Llc | $190,000 | Accommodation | |
| Janik Anna J | $102,500 | Attorney | |
| Swinehart Jerod A | $100,000 | Talon Group | |
| Whittenburg Jacquelin A | $69,900 | -- | |
| -- | -- | -- | |
| -- | $54,500 | -- |
Source: Public Records
Mortgage History
| Date | Status | Borrower | Loan Amount |
|---|---|---|---|
| Previous Owner | Janik Anna J | $100,642 | |
| Previous Owner | Swinehart Jerod A | $80,000 |
Source: Public Records
Tax History Compared to Growth
Tax History
| Year | Tax Paid | Tax Assessment Tax Assessment Total Assessment is a certain percentage of the fair market value that is determined by local assessors to be the total taxable value of land and additions on the property. | Land | Improvement |
|---|---|---|---|---|
| 2024 | $3,043 | $66,400 | $17,500 | $48,900 |
| 2023 | $3,005 | $66,395 | $17,500 | $48,895 |
| 2022 | $2,217 | $41,720 | $12,600 | $29,120 |
| 2021 | $2,168 | $41,720 | $12,600 | $29,120 |
| 2020 | $2,170 | $41,720 | $12,600 | $29,120 |
| 2019 | $2,043 | $33,670 | $10,080 | $23,590 |
| 2018 | $1,864 | $33,670 | $10,080 | $23,590 |
| 2017 | $1,952 | $33,670 | $10,080 | $23,590 |
| 2016 | $1,862 | $28,110 | $7,670 | $20,440 |
| 2015 | $1,690 | $28,110 | $7,670 | $20,440 |
| 2014 | $1,694 | $28,110 | $7,670 | $20,440 |
| 2013 | $929 | $31,220 | $8,505 | $22,715 |
Source: Public Records
Map
Nearby Homes
- 1549 Alpine Dr
- 1288 Oakfield Dr N
- 6035 Karl Rd
- 5990 Ambleside Dr
- 6189 Northgap Dr
- 1390 E Dublin Granville Rd
- 6211 Parkdale Dr
- 1171 Newbury Dr
- 1268 Kildale Ct
- 6407 Faircrest Rd
- 6342 Bellmeadow Dr
- 6458 Faircrest Rd
- 1409 Bosworth Place
- 1421 Bosworth Place
- 1752 Pine Tree St S Unit H
- 1743 Pine Tree St N Unit A
- 6407 Skywae Dr
- 1294 Clydesdale Ct
- 1492 Cottonwood Dr
- 1635 Tendril Ct
- 1420 Burnley Square N
- 1436 Burnley Square N
- 1444 Burnley Square N
- 1414 Burnley Square N
- 1427 Alpine Dr
- 1421 Alpine Dr
- 1439 Alpine Dr
- 1417 Alpine Dr
- 1427 Burnley Square N
- 1435 Burnley Square N
- 1419 Burnley Square N
- 1449 Alpine Dr
- 6166 Ambleside Dr
- 1443 Burnley Square N
- 1415 Burnley Square N
- 1460 Burnley Square N
- 1457 Alpine Dr
- 1453 Burnley Square N
- 6176 Ambleside Dr Unit 182
- 6138 Ambleside Dr