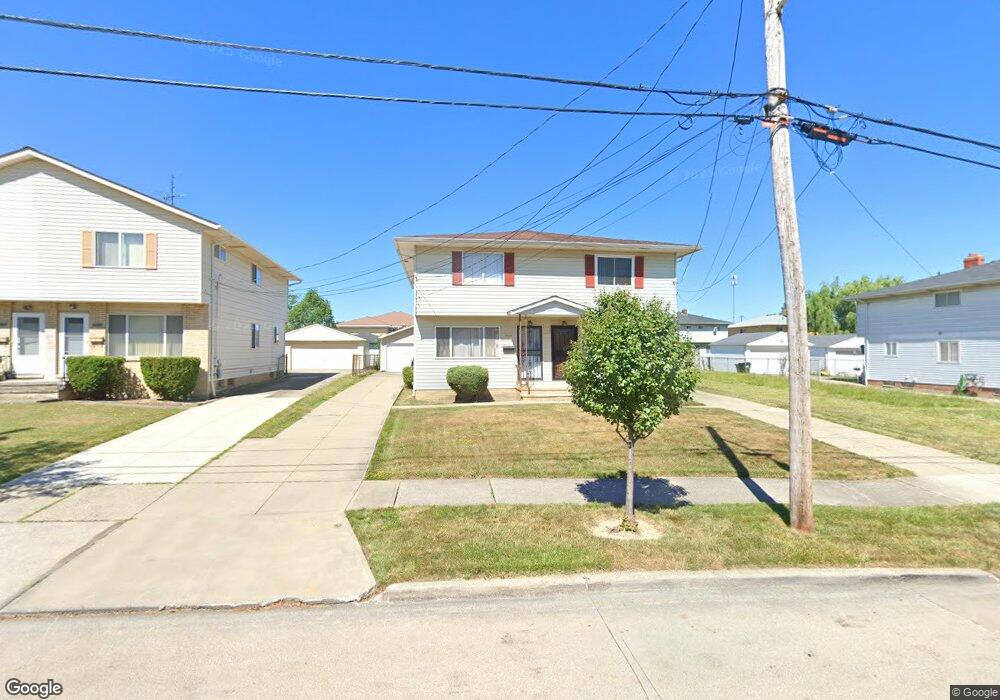
1428 E 263rd St Euclid, OH 44132
Estimated Value: $92,000 - $132,495
3
Beds
2
Baths
1,216
Sq Ft
$91/Sq Ft
Est. Value
About This Home
This home is located at 1428 E 263rd St, Euclid, OH 44132 and is currently estimated at $110,374, approximately $90 per square foot. 1428 E 263rd St is a home located in Cuyahoga County with nearby schools including Bluestone Elementary School, Euclid High School, and All Saints of St. John Vianney School.
Ownership History
Date
Name
Owned For
Owner Type
Purchase Details
Closed on
Apr 12, 2017
Sold by
Hemlock Deborah and Hemlock Steven Jeffrey
Bought by
Hemlock Deborah and Tylicki Hemlock Deborah
Current Estimated Value
Purchase Details
Closed on
Feb 12, 2008
Sold by
Hud
Bought by
Hemlock Steve and Hemlock Deborah
Purchase Details
Closed on
Sep 19, 2007
Sold by
Everbank
Bought by
Hud
Purchase Details
Closed on
Apr 16, 2007
Sold by
Mcintyre James T
Bought by
Everbank
Purchase Details
Closed on
May 13, 1998
Sold by
Mcintyre Sabrina E
Bought by
Mcintyre James T
Purchase Details
Closed on
Dec 10, 1990
Sold by
Arendt Michael J
Bought by
Mcintyre James T
Purchase Details
Closed on
Sep 15, 1977
Sold by
Maiorani Raymond M
Bought by
Arendt Michael J
Purchase Details
Closed on
May 10, 1976
Bought by
Maiorani Raymond M
Purchase Details
Closed on
Jan 1, 1975
Bought by
Dal Construction Inc
Create a Home Valuation Report for This Property
The Home Valuation Report is an in-depth analysis detailing your home's value as well as a comparison with similar homes in the area
Home Values in the Area
Average Home Value in this Area
Purchase History
| Date | Buyer | Sale Price | Title Company |
|---|---|---|---|
| Hemlock Deborah | -- | None Available | |
| Hemlock Steve | $33,500 | Lakeside Title & Escrow Agen | |
| Hud | -- | Attorney | |
| Everbank | $50,000 | Attorney | |
| Mcintyre James T | -- | -- | |
| Mcintyre James T | $55,000 | -- | |
| Arendt Michael J | $71,500 | -- | |
| Maiorani Raymond M | $62,000 | -- | |
| Dal Construction Inc | -- | -- |
Source: Public Records
Tax History
| Year | Tax Paid | Tax Assessment Tax Assessment Total Assessment is a certain percentage of the fair market value that is determined by local assessors to be the total taxable value of land and additions on the property. | Land | Improvement |
|---|---|---|---|---|
| 2025 | $2,912 | $42,735 | $7,105 | $35,630 |
| 2024 | $2,999 | $42,735 | $7,105 | $35,630 |
| 2023 | $2,367 | $26,570 | $5,500 | $21,070 |
| 2022 | $2,315 | $26,570 | $5,500 | $21,070 |
| 2021 | $2,575 | $26,570 | $5,500 | $21,070 |
| 2020 | $2,167 | $20,130 | $4,170 | $15,960 |
| 2019 | $1,950 | $57,500 | $11,900 | $45,600 |
| 2018 | $1,950 | $20,130 | $4,170 | $15,960 |
| 2017 | $2,084 | $17,820 | $3,430 | $14,390 |
| 2016 | $2,089 | $17,820 | $3,430 | $14,390 |
| 2015 | $2,225 | $17,820 | $3,430 | $14,390 |
| 2014 | $2,225 | $20,970 | $4,030 | $16,940 |
Source: Public Records
Map
Nearby Homes
- 1471 Hall Ct
- 1437 E 252nd St
- 1670 Hillandale Dr
- 1530 E 254th St
- 1552 E 254th St
- 127 Brush Rd
- 145 Richmond Rd
- 25161 Euclid Ave
- 890 E 250th St
- 24991 Euclid Ave
- 797 Babbitt Rd Unit 15
- 795 E 260th St
- 1790 Skyline Dr
- 24691 Hawthorne Dr
- 942 E 236th St
- 1807 Skyline Dr
- 25641 Glenbrook Blvd
- 24431 Hartland Rd
- 25550 Glenbrook Blvd
- 815 E 272nd St
- 1426 E 263rd St
- 1432 E 263rd St
- 1434 E 263rd St
- 1400 E 263rd St
- 1403 E 263rd St
- 1406 E 263rd St
- 1440 E 263rd St
- 1440 E 263rd St Unit Right
- 1440 E 263rd St Unit 1440
- 1440 E 263rd St Unit 1442
- 1442 E 263rd St Unit 2
- 1404 E 263rd St
- 1427 E 262nd St
- 1423 E 262nd St
- 1433 E 262nd St
- 1417 E 262nd St
- 1423 E 263rd St
- 1444 E 263rd St
- 1407 E 262nd St
- 1437 E 262nd St
Your Personal Tour Guide
Ask me questions while you tour the home.