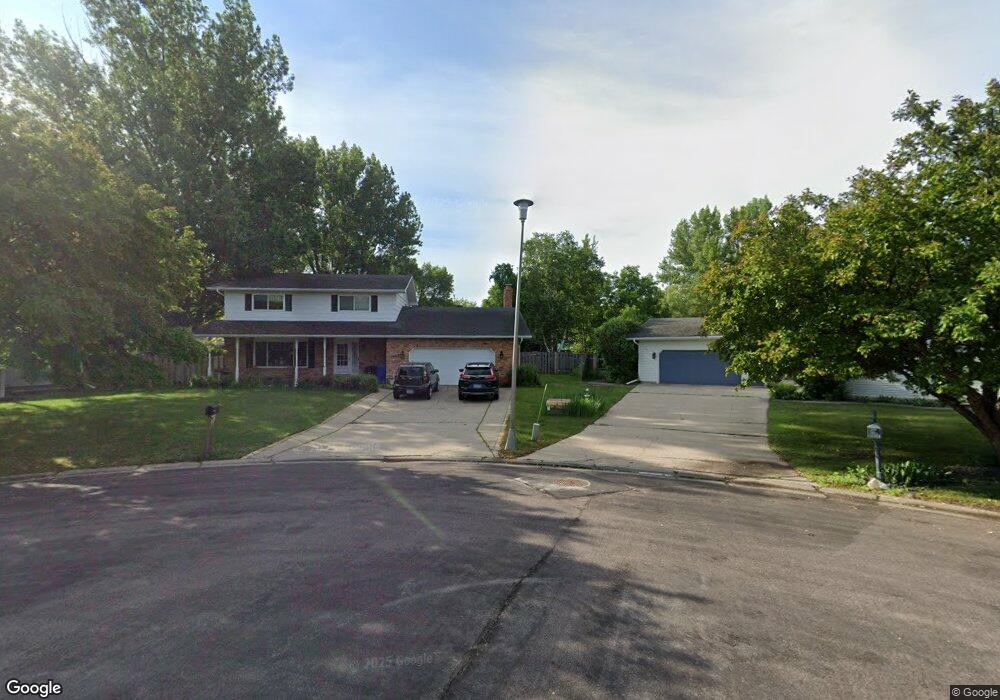
1428 W Gateway Cir S Fargo, ND 58103
Westgate NeighborhoodEstimated Value: $385,000 - $457,447
4
Beds
4
Baths
3,182
Sq Ft
$130/Sq Ft
Est. Value
About This Home
This home is located at 1428 W Gateway Cir S, Fargo, ND 58103 and is currently estimated at $414,112, approximately $130 per square foot. 1428 W Gateway Cir S is a home located in Cass County with nearby schools including Lewis & Clark Elementary School, Carl Ben Eielson Middle School, and South High School.
Ownership History
Date
Name
Owned For
Owner Type
Purchase Details
Closed on
May 25, 2018
Sold by
Kaldor Adam K and Kaldor Amanda L
Bought by
Ellingson David M and Ellingson Randi S
Current Estimated Value
Home Financials for this Owner
Home Financials are based on the most recent Mortgage that was taken out on this home.
Original Mortgage
$284,798
Outstanding Balance
$245,221
Interest Rate
4.4%
Mortgage Type
New Conventional
Estimated Equity
$168,891
Purchase Details
Closed on
Dec 2, 2009
Sold by
Nesemeier Kathleen F
Bought by
Kaldor Adam K and Kaldor Amanda L
Home Financials for this Owner
Home Financials are based on the most recent Mortgage that was taken out on this home.
Original Mortgage
$195,850
Interest Rate
5%
Mortgage Type
FHA
Create a Home Valuation Report for This Property
The Home Valuation Report is an in-depth analysis detailing your home's value as well as a comparison with similar homes in the area
Home Values in the Area
Average Home Value in this Area
Purchase History
| Date | Buyer | Sale Price | Title Company |
|---|---|---|---|
| Ellingson David M | $300,000 | Fm Title | |
| Kaldor Adam K | -- | -- |
Source: Public Records
Mortgage History
| Date | Status | Borrower | Loan Amount |
|---|---|---|---|
| Open | Ellingson David M | $284,798 | |
| Previous Owner | Kaldor Adam K | $195,850 |
Source: Public Records
Tax History Compared to Growth
Tax History
| Year | Tax Paid | Tax Assessment Tax Assessment Total Assessment is a certain percentage of the fair market value that is determined by local assessors to be the total taxable value of land and additions on the property. | Land | Improvement |
|---|---|---|---|---|
| 2024 | $4,840 | $185,200 | $52,000 | $133,200 |
| 2023 | $4,669 | $161,050 | $52,000 | $109,050 |
| 2022 | $4,720 | $161,050 | $52,000 | $109,050 |
| 2021 | $3,851 | $131,400 | $51,250 | $80,150 |
| 2020 | $3,805 | $131,400 | $51,250 | $80,150 |
| 2019 | $3,808 | $131,400 | $32,050 | $99,350 |
| 2018 | $3,763 | $131,400 | $32,050 | $99,350 |
| 2017 | $3,566 | $125,150 | $32,050 | $93,100 |
| 2016 | $3,179 | $121,500 | $32,050 | $89,450 |
| 2015 | $3,591 | $130,300 | $21,800 | $108,500 |
| 2014 | $3,348 | $117,650 | $21,800 | $95,850 |
| 2013 | $3,343 | $117,650 | $21,800 | $95,850 |
Source: Public Records
Map
Nearby Homes
- 2867 Westgate Dr S
- 1402 E Gateway Cir S Unit M
- 3305 15th Ave S Unit B
- 2402 N Flickertail Dr S Unit 1
- 3311 15th Ave S Unit E
- 3249 16th Ave S Unit 4
- 21 Birch Ln S
- 3237 17th Ave S Unit 101
- 3253 17th Ave S Unit 101
- 3253 17th Ave S Unit 102
- 2202 15th Ave S
- 1129 22nd St S Unit B09
- 1129 22nd St S Unit B12
- 2013 13th Ave S
- 3420 17th Ave S Unit A
- 3325 W Prairiewood Dr S
- 1737 Park Blvd S
- 1407 17th St S
- 2209 6th Ave S
- 2126 5th Ave S
- 1434 W Gateway Cir S
- 1422 W Gateway Cir S
- 1422 W Gateway Cir S
- 2819 Westgate Dr S
- 2813 Westgate Dr S
- 2825 Westgate Dr S
- 2831 Westgate Dr S
- 2807 Westgate Dr S
- 2837 Westgate Dr S
- 1440 W Gateway Cir S
- 2843 Westgate Dr S
- 1416 W Gateway Cir S
- 1464 W Gateway Cir S
- 2801 Westgate Dr S
- 2849 Westgate Dr S
- 1458 W Gateway Cir S
- 1446 W Gateway Cir S
- 2855 Westgate Dr S
- 2820 Westgate Dr S
- 2814 Westgate Dr S