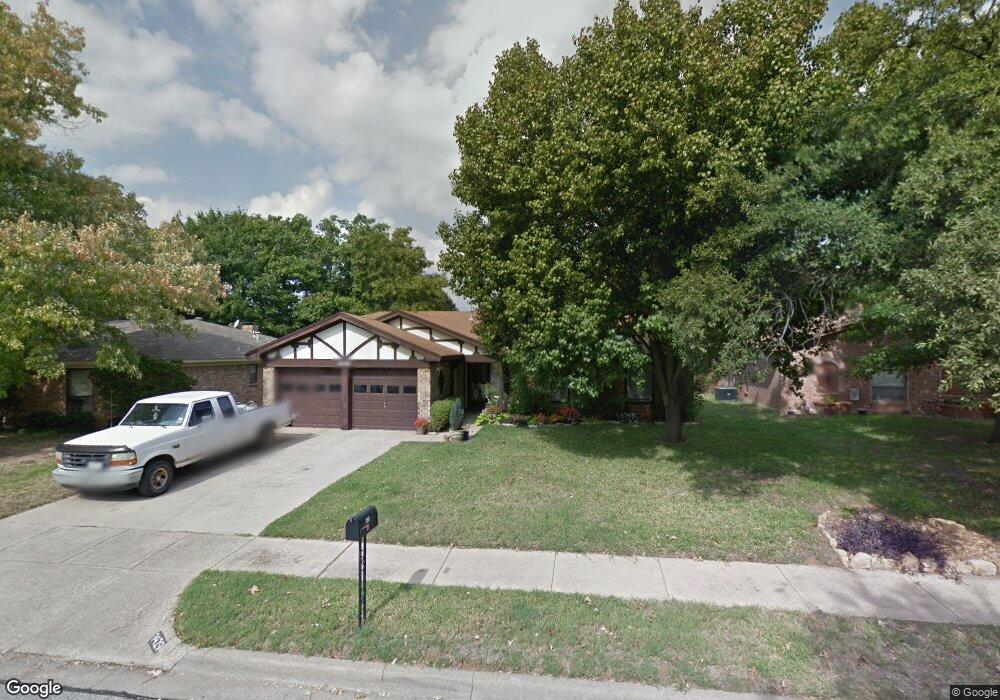
1429 Bryan Dr Bedford, TX 76022
Estimated Value: $317,000 - $328,684
3
Beds
2
Baths
1,519
Sq Ft
$211/Sq Ft
Est. Value
About This Home
This home is located at 1429 Bryan Dr, Bedford, TX 76022 and is currently estimated at $321,171, approximately $211 per square foot. 1429 Bryan Dr is a home located in Tarrant County with nearby schools including Bell Manor Elementary School, Central J High School, and Trinity High School.
Ownership History
Date
Name
Owned For
Owner Type
Purchase Details
Closed on
Nov 29, 2007
Sold by
Farrow Kasey
Bought by
Hanson William and Hanson Rhonda
Current Estimated Value
Home Financials for this Owner
Home Financials are based on the most recent Mortgage that was taken out on this home.
Original Mortgage
$133,941
Outstanding Balance
$85,216
Interest Rate
6.4%
Mortgage Type
Purchase Money Mortgage
Estimated Equity
$235,955
Purchase Details
Closed on
Aug 6, 2003
Sold by
Simon Gerri L
Bought by
Farrow Kasey
Home Financials for this Owner
Home Financials are based on the most recent Mortgage that was taken out on this home.
Original Mortgage
$121,600
Interest Rate
5.24%
Mortgage Type
Purchase Money Mortgage
Purchase Details
Closed on
Oct 31, 2002
Sold by
Neal Daniel Robb and Neal Lanita Carol
Bought by
Simon Gerri L
Home Financials for this Owner
Home Financials are based on the most recent Mortgage that was taken out on this home.
Original Mortgage
$121,099
Interest Rate
5.95%
Create a Home Valuation Report for This Property
The Home Valuation Report is an in-depth analysis detailing your home's value as well as a comparison with similar homes in the area
Home Values in the Area
Average Home Value in this Area
Purchase History
| Date | Buyer | Sale Price | Title Company |
|---|---|---|---|
| Hanson William | -- | Federal Title Inc | |
| Farrow Kasey | -- | Commerce Title | |
| Simon Gerri L | -- | Rattikin Title |
Source: Public Records
Mortgage History
| Date | Status | Borrower | Loan Amount |
|---|---|---|---|
| Open | Hanson William | $133,941 | |
| Previous Owner | Farrow Kasey | $121,600 | |
| Previous Owner | Simon Gerri L | $121,099 |
Source: Public Records
Tax History Compared to Growth
Tax History
| Year | Tax Paid | Tax Assessment Tax Assessment Total Assessment is a certain percentage of the fair market value that is determined by local assessors to be the total taxable value of land and additions on the property. | Land | Improvement |
|---|---|---|---|---|
| 2025 | $4,047 | $269,000 | $65,000 | $204,000 |
| 2024 | $4,047 | $285,048 | $65,000 | $220,048 |
| 2023 | $4,720 | $272,539 | $45,000 | $227,539 |
| 2022 | $4,886 | $223,700 | $45,000 | $178,700 |
| 2021 | $5,182 | $223,700 | $45,000 | $178,700 |
| 2020 | $4,755 | $200,001 | $45,000 | $155,001 |
| 2019 | $4,859 | $200,000 | $45,000 | $155,000 |
| 2018 | $4,064 | $183,013 | $18,000 | $165,013 |
| 2017 | $4,025 | $166,394 | $18,000 | $148,394 |
| 2016 | $3,659 | $152,566 | $18,000 | $134,566 |
| 2015 | $2,864 | $142,752 | $18,000 | $124,752 |
| 2014 | $2,864 | $125,000 | $18,000 | $107,000 |
Source: Public Records
Map
Nearby Homes
- 1613 Trinity Ct
- 1701 Winchester Way
- 933 Charleston Ct
- 1604 Richmond Dr
- 1031 Boston Blvd
- 952 Charleston Dr
- 904 Nelson Terrace
- 1004 Overhill Dr
- 921 Overhill Dr
- 909 Overhill Dr
- 804 Natchez Ave
- 2024 Charleston Dr
- 1204 Edgecliff Dr
- 2101 Gettysburg Place
- 1509 Shirley Way
- 2025 Schumac Ln
- 2201 Greendale Ct
- 1213 Briar Dr
- 1213 Greendale Dr
- 828 Gregory Ave
- 1433 Bryan Dr
- 1421 Bryan Dr
- 1628 Lexington Place
- 1624 Lexington Place
- 1632 Lexington Place
- 1620 Lexington Place
- 1428 Bryan Dr
- 1417 Bryan Dr
- 1424 Bryan Dr
- 1432 Bryan Dr
- 936 Columbus Ct
- 1616 Lexington Place
- 1020 Monterrey St
- 1016 Monterrey St
- 1024 Monterrey St
- 1413 Bryan Dr
- 1012 Monterrey St
- 932 Columbus Ct
- 1612 Lexington Place
- 1028 Monterrey St