C
Landlord's Agent in 2021
Chunhang Zhu
Libra Realty, LLC
(703) 829-7788
3 in this area
16 Total Sales
Estimated Value: $1,468,000 - $1,726,000
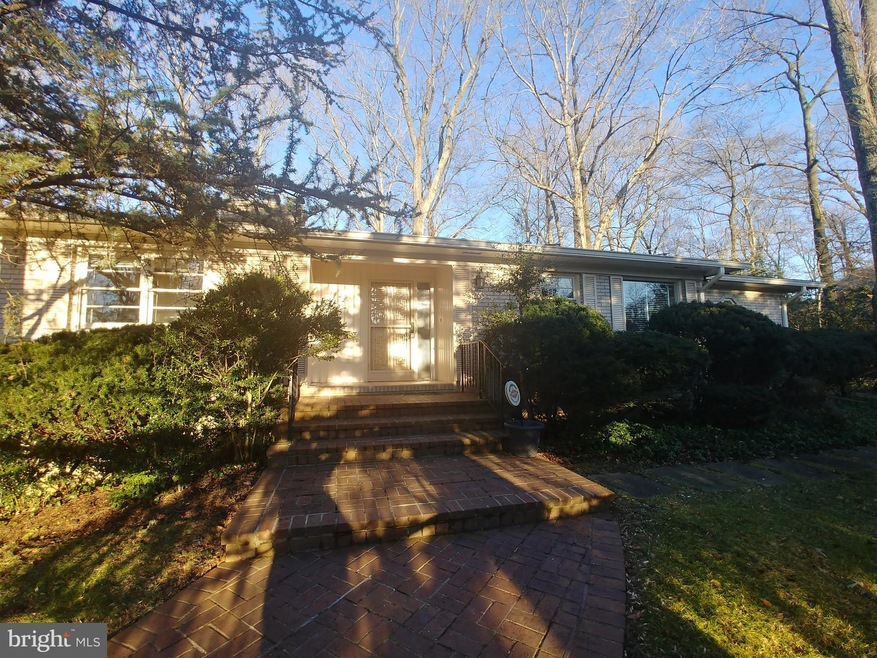
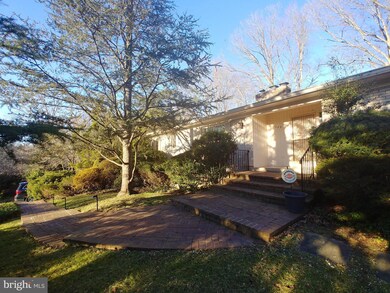
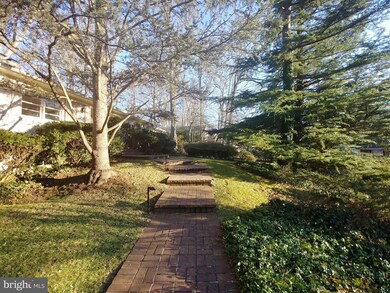
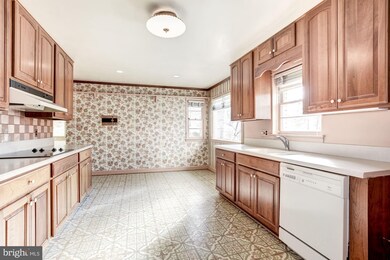
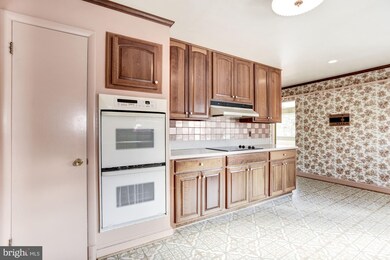
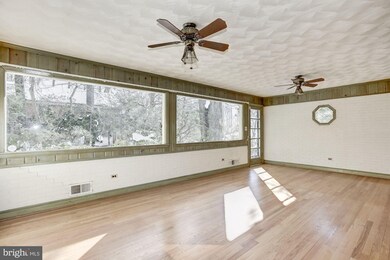
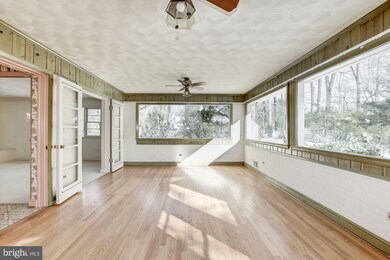
Brand new carpet in living and dining room. Large beautifully landscaped 0.52-acre lot in sought after Chesterbrook Woods- only 1 light to DC! Huge rambler with sun room. Carpet in main level bed rooms and hall way is only 2 yrs old. Large and light-filled living room with bay window and wood burning fireplace. Large Kitchen with substantial cabinetry and counter space and eat-in area. Lower level walk-out with large fam room and wood burning fireplace. 2 additional bedrooms in the lower level. 1.5-car side-loading garage.
Last Agent to Rent the Property
(703) 829-7788 realtor@chzgroup.com Libra Realty, LLC License #0225076684 Listed on: 03/15/2021
Last Renter's Agent
Jonathan Jefferson
(202) 527-4674 j.jefferson@kw.com eXp Commercial License #0225246715

| Date | Buyer | Sale Price | Title Company |
|---|---|---|---|
| Jiahao Llc | $1,010,000 | Icon Title Llc |
| Date | Event | Price | List to Sale | Price per Sq Ft | Prior Sale |
|---|---|---|---|---|---|
| 05/03/2021 05/03/21 | Rented | $4,000 | 0.0% | -- | |
| 03/15/2021 03/15/21 | For Rent | $4,000 | +1.3% | -- | |
| 03/04/2019 03/04/19 | Rented | $3,950 | -1.3% | -- | |
| 02/15/2019 02/15/19 | Under Contract | -- | -- | -- | |
| 02/13/2019 02/13/19 | For Rent | $4,000 | 0.0% | -- | |
| 01/31/2019 01/31/19 | Sold | $1,010,000 | -3.8% | $491 / Sq Ft | View Prior Sale |
| 01/21/2019 01/21/19 | Pending | -- | -- | -- | |
| 01/17/2019 01/17/19 | For Sale | $1,050,000 | -- | $511 / Sq Ft |
| Year | Tax Paid | Tax Assessment Tax Assessment Total Assessment is a certain percentage of the fair market value that is determined by local assessors to be the total taxable value of land and additions on the property. | Land | Improvement |
|---|---|---|---|---|
| 2025 | $15,772 | $1,404,610 | $792,000 | $612,610 |
| 2024 | $15,772 | $1,287,930 | $792,000 | $495,930 |
| 2023 | $15,270 | $1,283,580 | $792,000 | $491,580 |
| 2022 | $13,665 | $1,130,710 | $654,000 | $476,710 |
| 2021 | $12,970 | $1,050,550 | $590,000 | $460,550 |
| 2020 | $12,958 | $1,043,360 | $590,000 | $453,360 |
| 2019 | $13,541 | $1,090,450 | $590,000 | $500,450 |
| 2018 | $12,108 | $1,052,870 | $567,000 | $485,870 |
| 2017 | $6,546 | $958,270 | $543,000 | $415,270 |
| 2016 | $7,515 | $980,130 | $543,000 | $437,130 |
| 2015 | $10,989 | $934,530 | $526,000 | $408,530 |
| 2014 | $6,069 | $891,690 | $526,000 | $365,690 |
C
Landlord's Agent in 2021
Chunhang Zhu
Libra Realty, LLC
(703) 829-7788
3 in this area
16 Total Sales
J
Tenant's Agent in 2021
Jonathan Jefferson
eXp Commercial
Seller's Agent in 2019
Lizzy Conroy
Serhant
(202) 441-3630
110 in this area
217 Total Sales
Seller Co-Listing Agent in 2019
Karen Briscoe
Serhant
(703) 582-6818
95 in this area
215 Total Sales
Source: Bright MLS
MLS Number: VAFX1186596
APN: 0312-09-0005
Disclaimer: Certain information contained herein is derived from information provided by parties other than Homes.com. All information provided is deemed reliable, but is not guaranteed to be accurate and should be independently verified.
![]() The data relating to real estate for sale on this website appears in part through the BRIGHT Internet Data Exchange program, a voluntary cooperative exchange of property listing data between licensed real estate brokerage firms, and is provided by BRIGHT through a licensing agreement.
The data relating to real estate for sale on this website appears in part through the BRIGHT Internet Data Exchange program, a voluntary cooperative exchange of property listing data between licensed real estate brokerage firms, and is provided by BRIGHT through a licensing agreement.
Listing information is from various brokers who participate in the Bright MLS IDX program and not all listings may be visible on the site.
The property information being provided on or through the website is for the personal, non-commercial use of consumers and such information may not be used for any purpose other than to identify prospective properties consumers may be interested in purchasing.
Some properties which appear for sale on the website may no longer be available because they are for instance, under contract, sold or are no longer being offered for sale.
Property information displayed is deemed reliable but is not guaranteed.
Copyright 2025 Bright MLS, Inc.