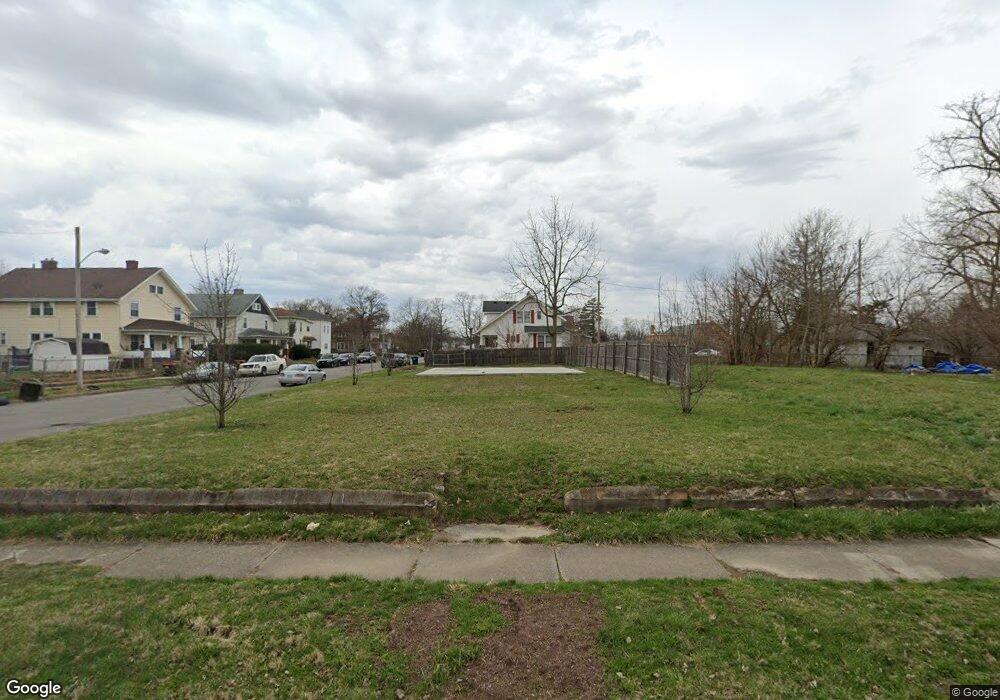
1429 Linden Ave Springfield, OH 45505
Estimated Value: $117,000 - $145,000
Studio
--
Bath
--
Sq Ft
7,492
Sq Ft Lot
About This Home
This home is located at 1429 Linden Ave, Springfield, OH 45505 and is currently estimated at $128,333. 1429 Linden Ave is a home located in Clark County with nearby schools including Lincoln Elementary School, Hayward Middle School, and Springfield High School.
Ownership History
Date
Name
Owned For
Owner Type
Purchase Details
Closed on
Jul 2, 2019
Sold by
Gray Norman L
Bought by
Ross Dewayne E
Current Estimated Value
Purchase Details
Closed on
May 17, 2016
Sold by
Ty Investments Llc
Bought by
Neighborhood Garden And Retreat Assn
Purchase Details
Closed on
Apr 14, 2011
Sold by
Fannie Mae
Bought by
Ty Investments Llc
Purchase Details
Closed on
Jan 25, 2011
Sold by
Hubbard William W
Bought by
Federal National Mortgage Association
Purchase Details
Closed on
Mar 24, 2006
Sold by
Hubbard William W and Hubbard Jeannie
Bought by
Johncar Investments Llc
Purchase Details
Closed on
Jul 14, 1999
Sold by
Pearl Lucille Jr Rice Kenneth Wallace
Bought by
Hubbard William W
Home Financials for this Owner
Home Financials are based on the most recent Mortgage that was taken out on this home.
Original Mortgage
$37,600
Interest Rate
9.75%
Mortgage Type
Purchase Money Mortgage
Create a Home Valuation Report for This Property
The Home Valuation Report is an in-depth analysis detailing your home's value as well as a comparison with similar homes in the area
Home Values in the Area
Average Home Value in this Area
Purchase History
| Date | Buyer | Sale Price | Title Company |
|---|---|---|---|
| Ross Dewayne E | $900 | None Available | |
| Neighborhood Garden And Retreat Assn | -- | Team Title & Closing Servic | |
| Ty Investments Llc | $1,000 | Team Title & Closing Service | |
| Federal National Mortgage Association | $1,000 | None Available | |
| Johncar Investments Llc | $140,500 | None Available | |
| Hubbard William W | $47,000 | -- |
Source: Public Records
Mortgage History
| Date | Status | Borrower | Loan Amount |
|---|---|---|---|
| Previous Owner | Hubbard William W | $37,600 |
Source: Public Records
Tax History
| Year | Tax Paid | Tax Assessment Tax Assessment Total Assessment is a certain percentage of the fair market value that is determined by local assessors to be the total taxable value of land and additions on the property. | Land | Improvement |
|---|---|---|---|---|
| 2025 | $205 | $820 | $820 | -- |
| 2024 | $296 | $700 | $700 | -- |
| 2023 | $156 | $700 | $700 | $0 |
| 2022 | $206 | $700 | $700 | $0 |
| 2021 | $32 | $580 | $580 | $0 |
| 2020 | $32 | $580 | $580 | $0 |
| 2019 | $32 | $580 | $580 | $0 |
| 2018 | $28 | $490 | $490 | $0 |
| 2017 | $28 | $487 | $487 | $0 |
| 2016 | $28 | $487 | $487 | $0 |
| 2015 | $29 | $487 | $487 | $0 |
| 2014 | $29 | $487 | $487 | $0 |
| 2013 | $28 | $487 | $487 | $0 |
Source: Public Records
Map
Nearby Homes
- 1502 Linden Ave
- 1417 Clifton Ave Unit 1419
- 1301-1303 Clifton Ave
- 1519 Tibbetts Ave
- 550 E Rose St
- 1724 Clay St
- 205 E Grand Ave
- 0 W Perrin Ave Unit 1043508
- 0 W Perrin Ave Unit 951292
- 1355 S Fountain Ave
- 1820 Clay St
- 1823 Clay St
- 441 E Euclid Ave
- 1754 S Fountain Ave
- 652 E Southern Ave
- 1008 Tibbetts Ave
- 1846 Ohio Ave
- 907-913 S Limestone St
- 1619 S Center Blvd
- 638 Clifton Ave
- 1423 Linden Ave
- 1419 Linden Ave
- 1501 Linden Ave Unit 1503
- 316 Catherine St
- 319 Catherine St Unit 321
- 1505 Linden Ave Unit 1507
- 1413 Linden Ave
- 312 Catherine St Unit 314
- 1430 Linden Ave
- 1426 Linden Ave
- 315 Catherine St Unit 317
- 1424 Linden Ave
- 306 Catherine St
- 1515 Linden Ave
- 1407 Linden Ave
- 1418 Linden Ave
- 309 Catherine St
- 1506 Linden Ave
- 309 E Rose St
- 1416 Linden Ave
Your Personal Tour Guide
Ask me questions while you tour the home.