
Seller's Agent in 2017
Andrea Butcher
RealHome Services and Solutions Inc/NH
(770) 612-7251
150 Total Sales

Estimated Value: $526,000 - $630,000
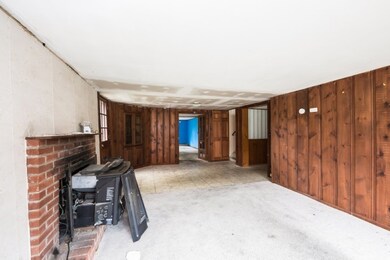
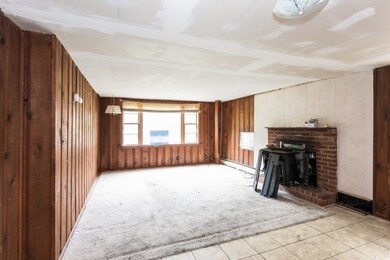
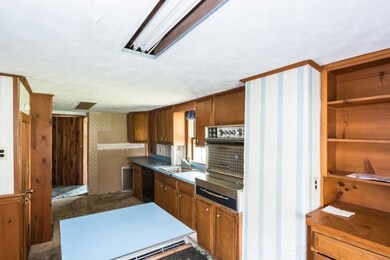
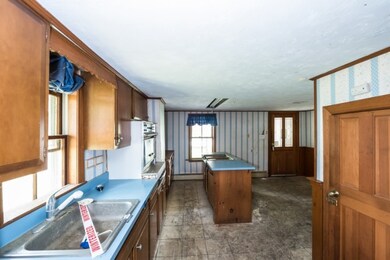
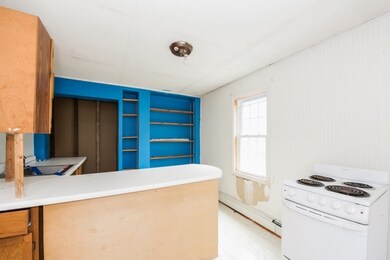
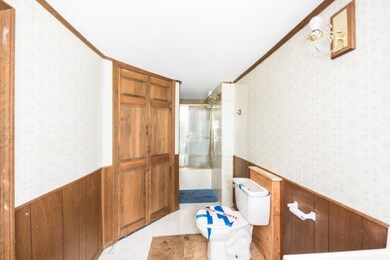
Vacant-Multi-family home with income potential. This home features 2 units- Total of 4 bedrooms, and 2 full bathrooms (2 Bed/1Bth each unit) on a large lot. You or your tenant can enjoy quick access to shopping, I-95, local campgrounds, restaurants, and Hampton Beach.
Last Agent to Sell the Property
RealHome Services and Solutions Inc/NH License #071670 Listed on: 05/08/2017
Last Buyer's Agent
A non PrimeMLS member
A Non PrimeMLS Agency
| Date | Buyer | Sale Price | Title Company |
|---|---|---|---|
| Onzalo Mark | $191,534 | -- | |
| Wells Fargo Bank Na Tr | $225,862 | -- |
| Date | Status | Borrower | Loan Amount |
|---|---|---|---|
| Open | Onzalo Mark | $188,064 |
| Date | Event | Price | List to Sale | Price per Sq Ft |
|---|---|---|---|---|
| 10/23/2017 10/23/17 | Sold | $191,534 | -21.4% | $94 / Sq Ft |
| 08/10/2017 08/10/17 | Pending | -- | -- | -- |
| 05/08/2017 05/08/17 | For Sale | $243,800 | -- | $120 / Sq Ft |
| Year | Tax Paid | Tax Assessment Tax Assessment Total Assessment is a certain percentage of the fair market value that is determined by local assessors to be the total taxable value of land and additions on the property. | Land | Improvement |
|---|---|---|---|---|
| 2024 | $5,798 | $494,700 | $235,500 | $259,200 |
| 2023 | $5,298 | $351,100 | $191,900 | $159,200 |
| 2022 | $4,652 | $351,100 | $191,900 | $159,200 |
| 2021 | $4,580 | $333,600 | $174,400 | $159,200 |
| 2020 | $2,902 | $228,200 | $139,600 | $88,600 |
| 2019 | $307 | $211,000 | $139,600 | $71,400 |
| 2018 | $3,239 | $199,300 | $127,900 | $71,400 |
| 2017 | $6,438 | $179,800 | $106,600 | $73,200 |
| 2016 | $2,659 | $179,800 | $106,600 | $73,200 |
| 2015 | $2,690 | $181,900 | $99,500 | $82,400 |
| 2014 | $2,778 | $181,900 | $99,500 | $82,400 |
| 2013 | $2,778 | $181,900 | $99,500 | $82,400 |
Seller's Agent in 2017
Andrea Butcher
RealHome Services and Solutions Inc/NH
(770) 612-7251
150 Total Sales
A
Buyer's Agent in 2017
A non PrimeMLS member
VT_ME_NH_NEREN
Source: PrimeMLS
MLS Number: 4632107
APN: SEAB-000003-000000-000012
Disclaimer: Certain information contained herein is derived from information provided by parties other than Homes.com. All information provided is deemed reliable, but is not guaranteed to be accurate and should be independently verified.
![]() Copyright 2025 PrimeMLS, Inc. All rights reserved. This information is deemed reliable, but not guaranteed. The data relating to real estate displayed on this display comes in part from the IDX Program of PrimeMLS. The information being provided is for consumers’ personal, non-commercial use and may not be used for any purpose other than to identify prospective properties consumers may be interested in purchasing.
Copyright 2025 PrimeMLS, Inc. All rights reserved. This information is deemed reliable, but not guaranteed. The data relating to real estate displayed on this display comes in part from the IDX Program of PrimeMLS. The information being provided is for consumers’ personal, non-commercial use and may not be used for any purpose other than to identify prospective properties consumers may be interested in purchasing.