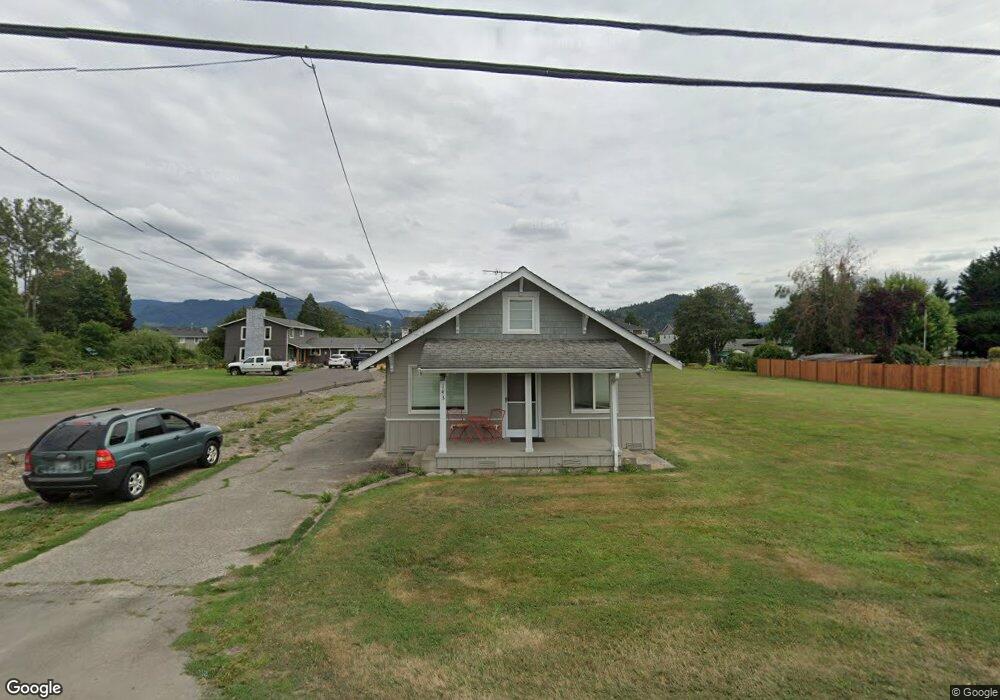
143 Blake St Enumclaw, WA 98022
Estimated Value: $432,000 - $523,009
2
Beds
1
Bath
940
Sq Ft
$496/Sq Ft
Est. Value
About This Home
This home is located at 143 Blake St, Enumclaw, WA 98022 and is currently estimated at $466,002, approximately $495 per square foot. 143 Blake St is a home located in King County with nearby schools including Southwood Elementary School, Enumclaw Middle School, and Enumclaw Senior High School.
Ownership History
Date
Name
Owned For
Owner Type
Purchase Details
Closed on
Jun 26, 2020
Sold by
Matson Christopher L
Bought by
Koopman John and Koopman Marlene
Current Estimated Value
Purchase Details
Closed on
Aug 6, 2001
Sold by
Hobbs Linda F
Bought by
Matson Christopher L
Home Financials for this Owner
Home Financials are based on the most recent Mortgage that was taken out on this home.
Original Mortgage
$106,250
Interest Rate
5.75%
Mortgage Type
Purchase Money Mortgage
Purchase Details
Closed on
Jul 27, 2001
Sold by
Vanhoof Dolores
Bought by
Hobbs Linda F
Home Financials for this Owner
Home Financials are based on the most recent Mortgage that was taken out on this home.
Original Mortgage
$106,250
Interest Rate
5.75%
Mortgage Type
Purchase Money Mortgage
Create a Home Valuation Report for This Property
The Home Valuation Report is an in-depth analysis detailing your home's value as well as a comparison with similar homes in the area
Home Values in the Area
Average Home Value in this Area
Purchase History
| Date | Buyer | Sale Price | Title Company |
|---|---|---|---|
| Koopman John | $361,000 | Old Republic Title Ltd | |
| Matson Christopher L | $125,000 | Commonwealth Land Title | |
| Hobbs Linda F | -- | Commonwealth Land Title |
Source: Public Records
Mortgage History
| Date | Status | Borrower | Loan Amount |
|---|---|---|---|
| Previous Owner | Matson Christopher L | $106,250 |
Source: Public Records
Tax History
| Year | Tax Paid | Tax Assessment Tax Assessment Total Assessment is a certain percentage of the fair market value that is determined by local assessors to be the total taxable value of land and additions on the property. | Land | Improvement |
|---|---|---|---|---|
| 2024 | $4,413 | $453,000 | $252,000 | $201,000 |
| 2023 | $4,102 | $389,000 | $217,000 | $172,000 |
| 2022 | $3,670 | $444,000 | $249,000 | $195,000 |
| 2021 | $3,478 | $360,000 | $215,000 | $145,000 |
| 2020 | $3,159 | $312,000 | $177,000 | $135,000 |
| 2018 | $2,713 | $282,000 | $162,000 | $120,000 |
| 2017 | $2,415 | $218,000 | $148,000 | $70,000 |
| 2016 | $2,292 | $200,000 | $136,000 | $64,000 |
| 2015 | $2,008 | $188,000 | $129,000 | $59,000 |
| 2014 | -- | $158,000 | $130,000 | $28,000 |
| 2013 | -- | $138,000 | $104,000 | $34,000 |
Source: Public Records
Map
Nearby Homes
- 505 Thompson (Lot 1) Dr
- 527 Thompson (Lot 2) Dr
- 508 Thompson (Lot 22) Dr
- 549 Thompson (Lot 3) Dr
- 571 Thompson (Lot 4) Dr
- 615 Thompson (Lot 6) Dr
- 637 Thompson (Lot 7) Dr
- 659 Thompson (Lot 8) Dr
- 311 Hogan Dr
- 673 Thompson (Lot 9) Dr
- 587 Thompson (Lot 10) Dr
- 176 Love Dr
- 936 Mountain Villa Dr
- 915 Mountain Villa Dr
- 823 Cottonwood Dr
- 806 Pine Dr
- 385 Bruhn Ln N
- 1137 Spruce Dr
- 1170 Cedar Dr
- 413 Becky Ave E
Your Personal Tour Guide
Ask me questions while you tour the home.