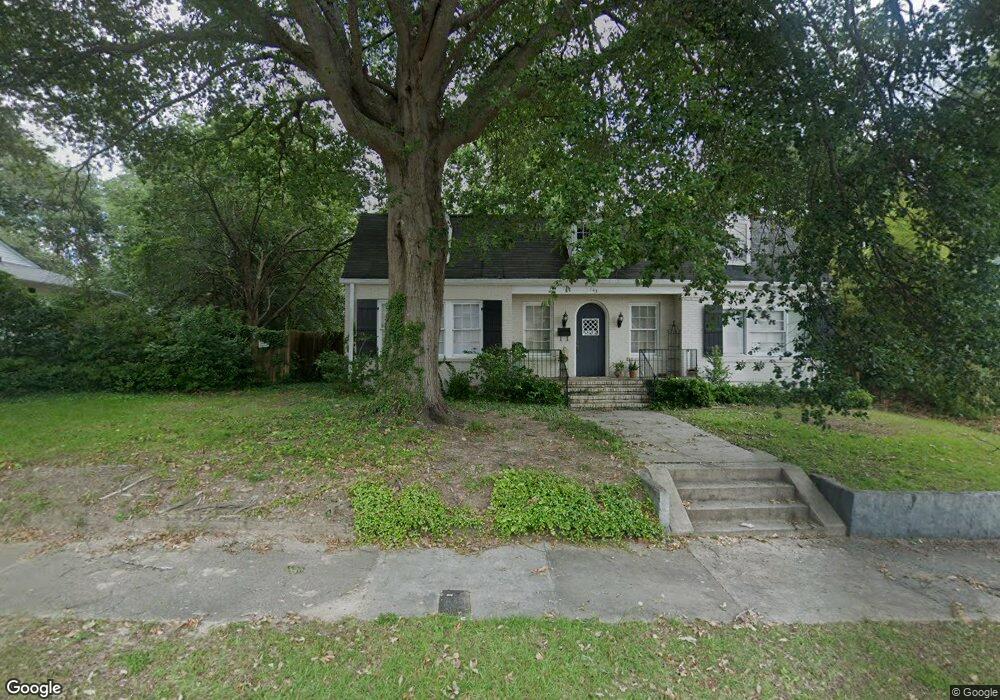
143 Calloway Dr Macon, GA 31204
Vineville Historic District NeighborhoodEstimated Value: $293,000 - $303,000
3
Beds
2
Baths
2,490
Sq Ft
$119/Sq Ft
Est. Value
About This Home
This home is located at 143 Calloway Dr, Macon, GA 31204 and is currently estimated at $296,249, approximately $118 per square foot. 143 Calloway Dr is a home located in Bibb County with nearby schools including Rosa Taylor Elementary School, Miller Fine Arts Magnet Middle School, and Central High School.
Ownership History
Date
Name
Owned For
Owner Type
Purchase Details
Closed on
Jul 16, 2019
Sold by
Tmw Mortgage Investments Llc
Bought by
Williams Rhonda P
Current Estimated Value
Home Financials for this Owner
Home Financials are based on the most recent Mortgage that was taken out on this home.
Original Mortgage
$136,482
Outstanding Balance
$119,314
Interest Rate
3.82%
Mortgage Type
FHA
Estimated Equity
$176,935
Purchase Details
Closed on
Jul 28, 2006
Bought by
Tmw Mortgage Invstms Llc
Home Financials for this Owner
Home Financials are based on the most recent Mortgage that was taken out on this home.
Original Mortgage
$750,000
Interest Rate
6.74%
Mortgage Type
Future Advance Clause Open End Mortgage
Purchase Details
Closed on
Feb 15, 2006
Create a Home Valuation Report for This Property
The Home Valuation Report is an in-depth analysis detailing your home's value as well as a comparison with similar homes in the area
Home Values in the Area
Average Home Value in this Area
Purchase History
| Date | Buyer | Sale Price | Title Company |
|---|---|---|---|
| Williams Rhonda P | $139,000 | None Available | |
| Tmw Mortgage Invstms Llc | $703,000 | -- | |
| -- | $92,800 | -- |
Source: Public Records
Mortgage History
| Date | Status | Borrower | Loan Amount |
|---|---|---|---|
| Open | Williams Rhonda P | $136,482 | |
| Previous Owner | Tmw Mortgage Invstms Llc | $750,000 |
Source: Public Records
Tax History
| Year | Tax Paid | Tax Assessment Tax Assessment Total Assessment is a certain percentage of the fair market value that is determined by local assessors to be the total taxable value of land and additions on the property. | Land | Improvement |
|---|---|---|---|---|
| 2025 | $1,877 | $83,393 | $14,400 | $68,993 |
| 2024 | $1,940 | $83,393 | $14,400 | $68,993 |
| 2023 | $1,418 | $80,842 | $14,400 | $66,442 |
| 2022 | $2,586 | $81,684 | $18,900 | $62,784 |
| 2021 | $1,990 | $59,367 | $18,144 | $41,223 |
| 2020 | $1,887 | $56,726 | $18,144 | $38,582 |
| 2019 | $2,117 | $54,086 | $18,144 | $35,942 |
| 2018 | $3,343 | $52,766 | $18,144 | $34,622 |
| 2017 | $2,089 | $55,770 | $19,099 | $36,671 |
| 2016 | $1,929 | $55,770 | $19,099 | $36,671 |
| 2015 | $2,701 | $55,770 | $19,099 | $36,671 |
| 2014 | $3,572 | $63,430 | $19,099 | $44,332 |
Source: Public Records
Map
Nearby Homes
- 155 Calloway Dr
- 175 Ave Unit B
- 175 Corbin Ave Unit B
- 175 Corbin Ave Unit E
- 175 Corbin Ave Unit A
- 175 Corbin Ave Unit E
- 175 Corbin Ave Unit A
- 127 Rogers Ave
- 227 Corbin Ave
- 230 Calloway Dr
- 172 Hines Terrace
- 218 Rogers Ave
- 173 Cleveland Ave
- 216 Hines Terrace
- 173 Pierce Ave
- 151 Culver St
- 2155 Ferguson St
- 215 Pierce Ave
- 198 Pio Nono Ave
- 171 Pio Nono Ave
- 131 Calloway Dr Unit 1
- 131 Calloway Dr
- 144 Corbin Ave
- 154 Corbin Ave
- 162 Corbin Ave
- 165 Calloway Dr
- 160 Calloway Dr
- 114 Corbin Ave
- 168 Corbin Ave
- 151 Corbin Ave
- 168 Calloway Dr
- 171 Calloway Dr
- 155 Corbin Ave
- 135 Corbin Ave
- 178 Corbin Ave
- 174 Calloway Dr
- 2437 Vineville Ave
- 127 Corbin Ave
- 165 Corbin Ave
- 111 Corbin Ave
Your Personal Tour Guide
Ask me questions while you tour the home.