143 Chapin St Southbridge, MA 01550
Estimated Value: $250,000 - $362,842
3
Beds
2
Baths
1,697
Sq Ft
$186/Sq Ft
Est. Value
About This Home
This home is located at 143 Chapin St, Southbridge, MA 01550 and is currently estimated at $315,211, approximately $185 per square foot. 143 Chapin St is a home located in Worcester County with nearby schools including Trinity Catholic Academy and ViewPoint Christian Academy.
Ownership History
Date
Name
Owned For
Owner Type
Purchase Details
Closed on
Jun 18, 2013
Sold by
Carron Mark and Keane-Caron Cynthia
Bought by
Keane Cynthia
Current Estimated Value
Purchase Details
Closed on
Apr 12, 2001
Sold by
Department Of Housing & Urban Dev
Bought by
Carron Mark J
Home Financials for this Owner
Home Financials are based on the most recent Mortgage that was taken out on this home.
Original Mortgage
$82,800
Interest Rate
6.97%
Mortgage Type
Purchase Money Mortgage
Purchase Details
Closed on
Dec 4, 2000
Sold by
Feeney James R
Bought by
Chase Manhattan Mtg
Purchase Details
Closed on
Nov 18, 1988
Sold by
Fontaine Bernard S
Bought by
Fontaine Kathleen L
Create a Home Valuation Report for This Property
The Home Valuation Report is an in-depth analysis detailing your home's value as well as a comparison with similar homes in the area
Home Values in the Area
Average Home Value in this Area
Purchase History
| Date | Buyer | Sale Price | Title Company |
|---|---|---|---|
| Keane Cynthia | -- | -- | |
| Keane Cynthia | -- | -- | |
| Carron Mark J | $92,050 | -- | |
| Carron Mark J | $92,050 | -- | |
| Chase Manhattan Mtg | $96,921 | -- | |
| Chase Manhattan Mtg | $96,921 | -- | |
| Fontaine Kathleen L | $10,000 | -- |
Source: Public Records
Mortgage History
| Date | Status | Borrower | Loan Amount |
|---|---|---|---|
| Previous Owner | Fontaine Kathleen L | $116,400 | |
| Previous Owner | Fontaine Kathleen L | $82,800 |
Source: Public Records
Tax History Compared to Growth
Tax History
| Year | Tax Paid | Tax Assessment Tax Assessment Total Assessment is a certain percentage of the fair market value that is determined by local assessors to be the total taxable value of land and additions on the property. | Land | Improvement |
|---|---|---|---|---|
| 2025 | $4,474 | $305,200 | $43,000 | $262,200 |
| 2024 | $4,177 | $273,700 | $35,800 | $237,900 |
| 2023 | $3,970 | $250,600 | $35,800 | $214,800 |
| 2022 | $3,784 | $211,400 | $30,600 | $180,800 |
| 2021 | $3,688 | $189,700 | $30,600 | $159,100 |
| 2020 | $3,378 | $173,400 | $30,600 | $142,800 |
| 2018 | $3,260 | $157,100 | $30,600 | $126,500 |
| 2017 | $2,974 | $144,600 | $30,600 | $114,000 |
| 2016 | $2,975 | $147,200 | $30,600 | $116,600 |
| 2015 | $3,091 | $151,800 | $30,600 | $121,200 |
| 2014 | $3,150 | $160,400 | $30,600 | $129,800 |
Source: Public Records
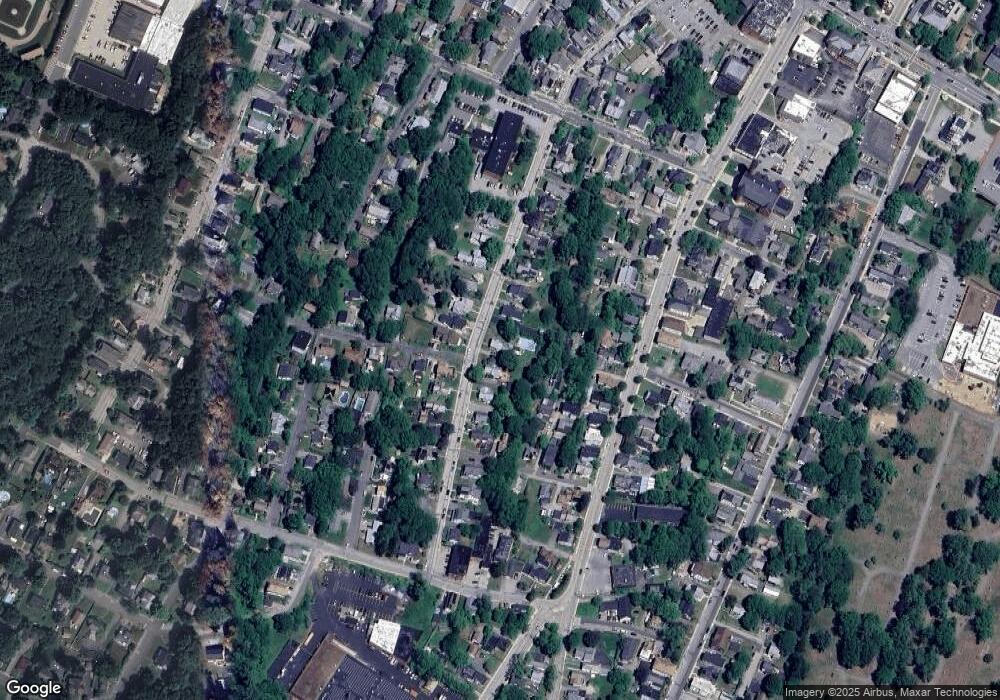
Map
Nearby Homes
- 149 Chapin St
- 131 Chapin St
- Lot 4 Parliament St
- 8 Crescent St
- 157 Chapin St
- 6 Crescent St
- 125 Chapin St
- 10 Crescent St
- 10 Crescent St Unit 1
- 10 Crescent St Unit 10
- 163 Chapin St
- 152 Chapin St Unit 152
- 165 Chapin St
- 4 Crescent St
- 140 Chapin St
- 12 Crescent St
- 117 Chapin St
- 158 Chapin St
- 144 Chapin St
- 9 Crescent St