
Landlord's Agent in 2024
Kristen Bishop
The Firm
(617) 962-7065
6 in this area
54 Total Sales
Estimated Value: $740,000 - $802,000
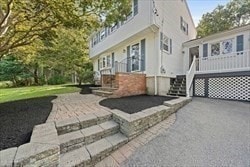
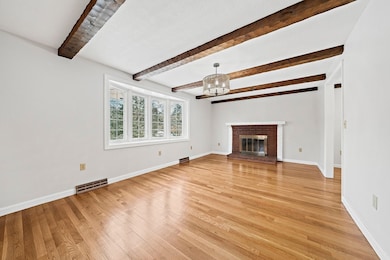
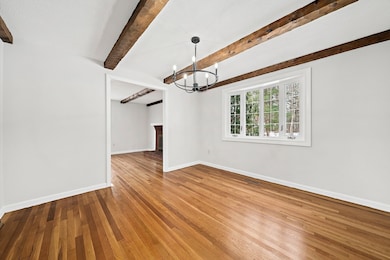
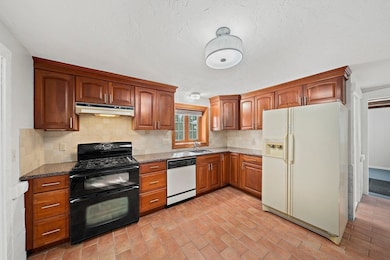
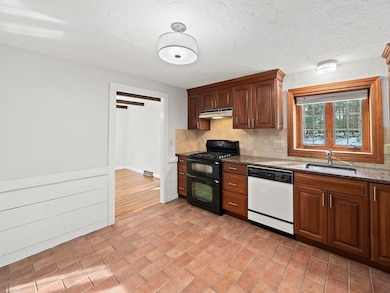
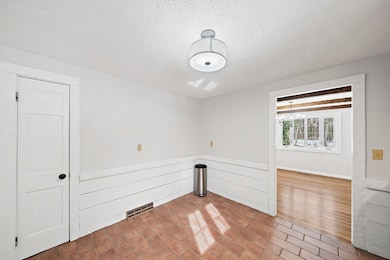
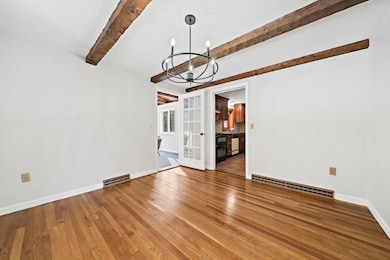
Hanover SINGLE FAMILY COLONIAL rental! Wonderful home in a great Walnut Hill location with easy access to Rt 3 & shops. Four bedrooms, 1.5 baths, hardwoods throughout, finished lower level, one car attached garage, gas heat, central AC all on an acre of land! First floor is expansive- mudroom/office, kitchen, living room, dining room, vaulted ceiling family room, half bath - plus a sunroom. Second floor has four good size bedrooms and a full bath -plus a full finished lower level with laundry room. All kitchen appliances and washer dryer are included in the rental. The home also has a one car attached garage and a huge front yard/back yard. Pets considered. Ideally looking for a 12 month+ rental, but open to flexible time frames for those looking to sell/buy/build a home.
We collect this data history from publicly available records. To have your information removed, we recommend requesting removal directly through your county’s website.
| Date | Buyer | Sale Price | Title Company |
|---|---|---|---|
| New Castle Nt | -- | -- | |
| Alexander Robert J | -- | -- |
We collect this data history from publicly available records. To have your information removed, we recommend requesting removal directly through your county’s website.
| Date | Status | Borrower | Loan Amount |
|---|---|---|---|
| Previous Owner | Alexander Robert J | $12,000 |
| Date | Event | Price | List to Sale | Price per Sq Ft | Prior Sale |
|---|---|---|---|---|---|
| 06/07/2024 06/07/24 | Rented | $4,400 | 0.0% | -- | |
| 05/15/2024 05/15/24 | Under Contract | -- | -- | -- | |
| 05/01/2024 05/01/24 | For Rent | $4,400 | +11.4% | -- | |
| 02/06/2024 02/06/24 | Rented | $3,950 | 0.0% | -- | |
| 02/05/2024 02/05/24 | Under Contract | -- | -- | -- | |
| 01/26/2024 01/26/24 | Off Market | $3,950 | -- | -- | |
| 01/22/2024 01/22/24 | For Rent | $3,950 | 0.0% | -- | |
| 10/23/2023 10/23/23 | Sold | $720,000 | +3.0% | $307 / Sq Ft | View Prior Sale |
| 10/05/2023 10/05/23 | Pending | -- | -- | -- | |
| 09/27/2023 09/27/23 | For Sale | $699,000 | -- | $298 / Sq Ft |
| Year | Tax Paid | Tax Assessment Tax Assessment Total Assessment is a certain percentage of the fair market value that is determined by local assessors to be the total taxable value of land and additions on the property. | Land | Improvement |
|---|---|---|---|---|
| 2025 | $8,408 | $680,800 | $269,600 | $411,200 |
| 2024 | $7,930 | $617,600 | $269,600 | $348,000 |
| 2023 | $7,372 | $546,500 | $245,100 | $301,400 |
| 2022 | $7,796 | $511,200 | $245,100 | $266,100 |
| 2021 | $7,657 | $468,900 | $222,800 | $246,100 |
| 2020 | $7,467 | $457,800 | $222,800 | $235,000 |
| 2019 | $7,260 | $442,400 | $222,800 | $219,600 |
| 2018 | $6,844 | $420,400 | $222,800 | $197,600 |
| 2017 | $6,653 | $402,700 | $210,000 | $192,700 |
| 2016 | $6,395 | $379,300 | $191,000 | $188,300 |
| 2015 | $6,126 | $379,300 | $191,000 | $188,300 |
Landlord's Agent in 2024
Kristen Bishop
The Firm
(617) 962-7065
6 in this area
54 Total Sales
Tenant's Agent in 2024
Phillip Tarantino
Tarantino Real Estate
(781) 582-1111
1 in this area
61 Total Sales
A
Seller's Agent in 2023
Allison Candura
Conway - Hanover
(781) 659-6650
5 in this area
33 Total Sales
Source: MLS Property Information Network (MLS PIN)
MLS Number: 73231156
APN: HANO-000016-000000-000065
Disclaimer: Certain information contained herein is derived from information provided by parties other than Homes.com. All information provided is deemed reliable, but is not guaranteed to be accurate and should be independently verified.
![]() The property listing data and information, or the Images, set forth herein were provided to MLS Property Information Network, Inc. from third party sources, including sellers, lessors and public records, and were compiled by MLS Property Information Network, Inc. The property listing data and information, and the Images, are for the personal, non-commercial use of consumers having a good faith interest in purchasing or leasing listed properties of the type displayed to them and may not be used for any purpose other than to identify prospective properties which such consumers may have a good faith interest in purchasing or leasing. MLS Property Information Network, Inc. and its subscribers disclaim any and all representations and warranties as to the accuracy of the property listing data and information, or as to the accuracy of any of the Images, set forth herein.
The property listing data and information, or the Images, set forth herein were provided to MLS Property Information Network, Inc. from third party sources, including sellers, lessors and public records, and were compiled by MLS Property Information Network, Inc. The property listing data and information, and the Images, are for the personal, non-commercial use of consumers having a good faith interest in purchasing or leasing listed properties of the type displayed to them and may not be used for any purpose other than to identify prospective properties which such consumers may have a good faith interest in purchasing or leasing. MLS Property Information Network, Inc. and its subscribers disclaim any and all representations and warranties as to the accuracy of the property listing data and information, or as to the accuracy of any of the Images, set forth herein.
Ask me questions while you tour the home.