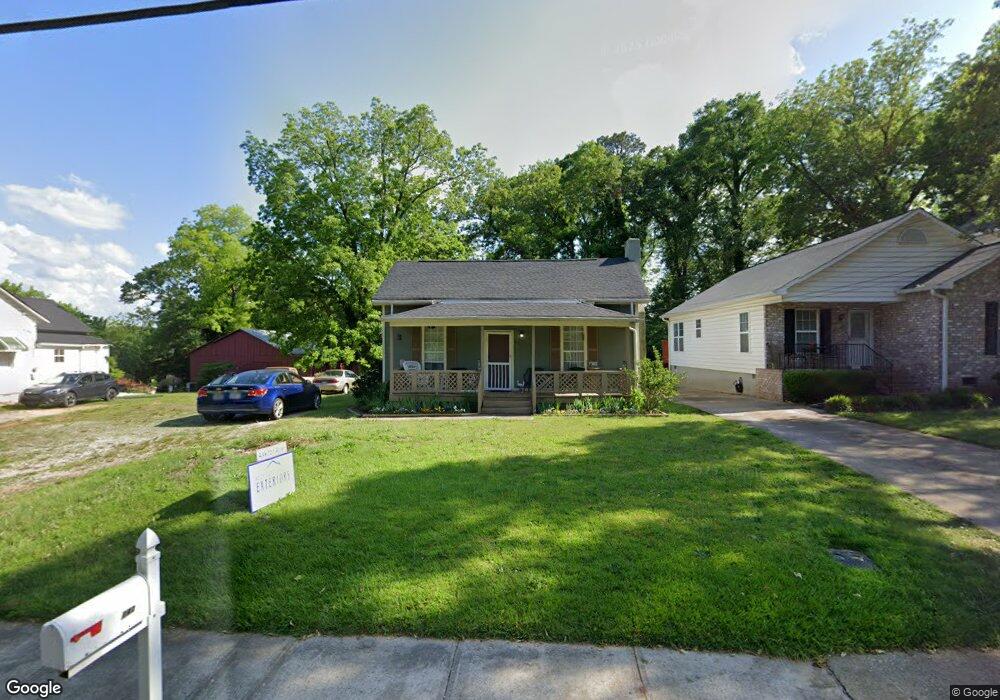
143 E Broad St Newnan, GA 30263
Estimated Value: $169,040 - $198,000
2
Beds
1
Bath
1,020
Sq Ft
$179/Sq Ft
Est. Value
About This Home
This home is located at 143 E Broad St, Newnan, GA 30263 and is currently estimated at $182,260, approximately $178 per square foot. 143 E Broad St is a home located in Coweta County with nearby schools including Welch Elementary School, Lee Middle School, and East Coweta High School.
Ownership History
Date
Name
Owned For
Owner Type
Purchase Details
Closed on
May 26, 2011
Sold by
Usa Rental Fund Llc
Bought by
Jones James Patton
Current Estimated Value
Purchase Details
Closed on
Sep 30, 2010
Sold by
Federal Natl Mtg Assn Fnma
Bought by
Usa Rental Fund Llc
Purchase Details
Closed on
Jul 6, 2010
Sold by
Hill Xavier
Bought by
Citimortgage Inc
Purchase Details
Closed on
Jan 13, 2004
Sold by
Knight Nathan G
Bought by
Knight Nathan G and Knight Elizabeth
Purchase Details
Closed on
Oct 23, 2003
Sold by
Nathan G Knight Estate
Bought by
Hill Xavier
Home Financials for this Owner
Home Financials are based on the most recent Mortgage that was taken out on this home.
Original Mortgage
$49,500
Interest Rate
6.16%
Mortgage Type
New Conventional
Purchase Details
Closed on
Nov 4, 2002
Sold by
Knight Nathan G
Bought by
Knight Ann Brady
Create a Home Valuation Report for This Property
The Home Valuation Report is an in-depth analysis detailing your home's value as well as a comparison with similar homes in the area
Purchase History
| Date | Buyer | Sale Price | Title Company |
|---|---|---|---|
| Jones James Patton | $17,500 | -- | |
| Usa Rental Fund Llc | $11,962 | -- | |
| Usa Rental Fund Llc | $12,000 | -- | |
| Citimortgage Inc | $28,400 | -- | |
| Knight Nathan G | -- | -- | |
| Hill Xavier | $55,000 | -- | |
| Knight Ann Brady | -- | -- |
Source: Public Records
Mortgage History
| Date | Status | Borrower | Loan Amount |
|---|---|---|---|
| Previous Owner | Hill Xavier | $49,500 |
Source: Public Records
Tax History
| Year | Tax Paid | Tax Assessment Tax Assessment Total Assessment is a certain percentage of the fair market value that is determined by local assessors to be the total taxable value of land and additions on the property. | Land | Improvement |
|---|---|---|---|---|
| 2025 | $1,822 | $75,848 | $41,500 | $34,348 |
| 2024 | $1,136 | $49,720 | $15,980 | $33,740 |
| 2023 | $1,136 | $50,773 | $15,980 | $34,793 |
Source: Public Records
Map
Nearby Homes
- 31 Pinson St
- 108 Savannah St
- 15 Davis St
- 59 Berry Ave
- 41 Wilcoxon St
- 51 Pope St
- 30 Chastain Cir
- 5 Casey Rd
- 123 Chastain Cir
- 127 Chastain Cir
- 11 Long St
- 2 Chastain Cir
- 267 E Broad St
- 140 Catalina Ct
- 254 Savoy Ct
- 0 N Highway 29 Unit 20115352
- 0 Jefferson St Unit 10662093
- 0 Highway 34 Unit 20149159
- 115 Greenville St
- 14 Farmer St
- E E Broad St Unit A-1
- E E Broad St Unit 1, 2, 3
- E E Broad St Unit TR A-1
- E E Broad St Unit 145
- E E Broad St Unit 140
- E E Broad St Unit 138
- E E Broad St Unit 139
- E E Broad St Unit 137
- E E Broad St Unit 142
- E E Broad St
- 141 E Broad St
- 147 E Broad St
- 149 E Broad St
- 137 E Broad St
- 139 E Broad St
- 142 E Broad St
- 140 E Broad St
- 136 E Broad St
- 135 E Broad St
- 155 E Broad St
Your Personal Tour Guide
Ask me questions while you tour the home.