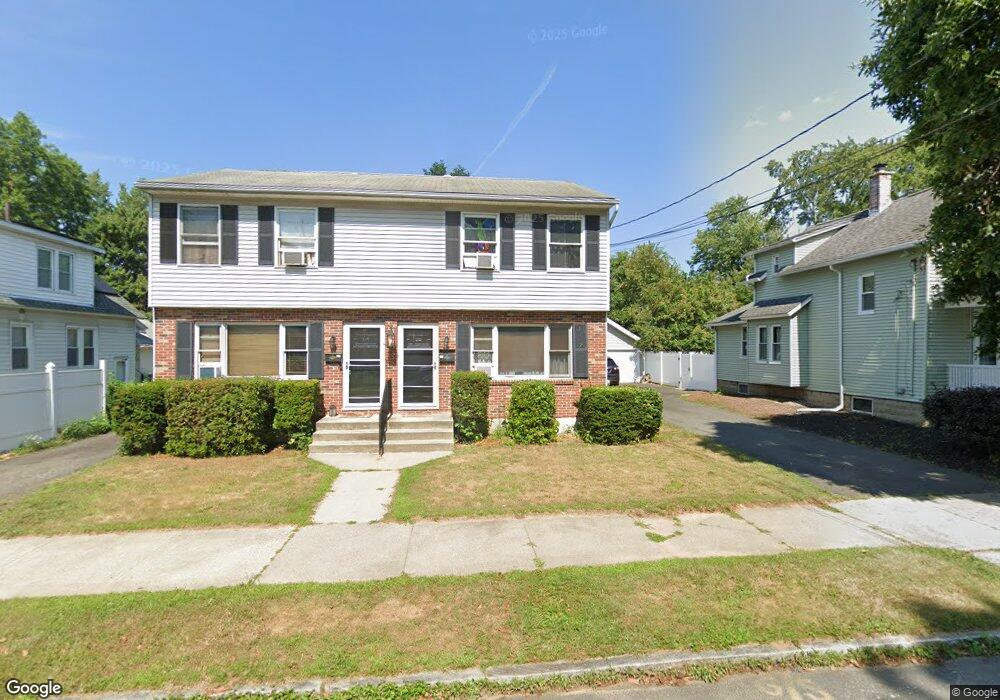
143 Eddy St Unit 147 Springfield, MA 01104
Liberty Heights NeighborhoodEstimated Value: $355,788 - $450,000
4
Beds
4
Baths
2,184
Sq Ft
$186/Sq Ft
Est. Value
About This Home
This home is located at 143 Eddy St Unit 147, Springfield, MA 01104 and is currently estimated at $405,197, approximately $185 per square foot. 143 Eddy St Unit 147 is a home located in Hampden County with nearby schools including Mary O. Pottenger Elementary School, Van Sickle Academy, and Springfield Central High School.
Ownership History
Date
Name
Owned For
Owner Type
Purchase Details
Closed on
Aug 18, 2009
Sold by
Tereso Jose A
Bought by
Merced Maritza
Current Estimated Value
Home Financials for this Owner
Home Financials are based on the most recent Mortgage that was taken out on this home.
Original Mortgage
$127,187
Outstanding Balance
$83,221
Interest Rate
5.36%
Mortgage Type
FHA
Estimated Equity
$321,976
Purchase Details
Closed on
Jun 5, 2006
Sold by
Tereso Jose A
Bought by
Tereso Jose A and Merced Maritza
Purchase Details
Closed on
Feb 16, 2001
Sold by
Richards Kim
Bought by
Tereso Jose A
Create a Home Valuation Report for This Property
The Home Valuation Report is an in-depth analysis detailing your home's value as well as a comparison with similar homes in the area
Home Values in the Area
Average Home Value in this Area
Purchase History
| Date | Buyer | Sale Price | Title Company |
|---|---|---|---|
| Merced Maritza | -- | -- | |
| Merced Maritza | -- | -- | |
| Merced Maritza | -- | -- | |
| Tereso Jose A | -- | -- | |
| Tereso Jose A | -- | -- | |
| Tereso Jose A | -- | -- | |
| Tereso Jose A | $111,500 | -- | |
| Tereso Jose A | $111,500 | -- |
Source: Public Records
Mortgage History
| Date | Status | Borrower | Loan Amount |
|---|---|---|---|
| Open | Merced Maritza | $127,187 | |
| Closed | Tereso Jose A | $127,187 |
Source: Public Records
Tax History
| Year | Tax Paid | Tax Assessment Tax Assessment Total Assessment is a certain percentage of the fair market value that is determined by local assessors to be the total taxable value of land and additions on the property. | Land | Improvement |
|---|---|---|---|---|
| 2025 | $5,198 | $331,500 | $37,200 | $294,300 |
| 2024 | $5,282 | $328,900 | $37,200 | $291,700 |
| 2023 | $4,598 | $269,700 | $32,900 | $236,800 |
| 2022 | $4,283 | $227,600 | $30,800 | $196,800 |
| 2021 | $4,020 | $212,700 | $28,000 | $184,700 |
| 2020 | $3,806 | $194,900 | $28,000 | $166,900 |
| 2019 | $3,568 | $181,300 | $30,500 | $150,800 |
| 2018 | $3,264 | $173,900 | $30,500 | $143,400 |
| 2017 | $3,264 | $166,000 | $27,600 | $138,400 |
| 2016 | $3,153 | $160,400 | $26,100 | $134,300 |
| 2015 | $2,897 | $147,300 | $26,100 | $121,200 |
Source: Public Records
Map
Nearby Homes
- 150 Drexel St
- 27 Parallel St
- 151 Littleton St
- 49 Upland St
- 33 Drexel St
- 119 Littleton St
- 59 Piedmont St
- 9 Utica St
- 73 Melville
- 28 Porter St
- 491-493 Newbury St
- 47 Victoria St
- 809 Carew St
- 774-776 Liberty St
- 143 Saint James Cir
- 1078 Liberty St
- 744-746 Carew St
- 83 Oklahoma St
- 74 David St
- 393 Saint James Ave
Your Personal Tour Guide
Ask me questions while you tour the home.