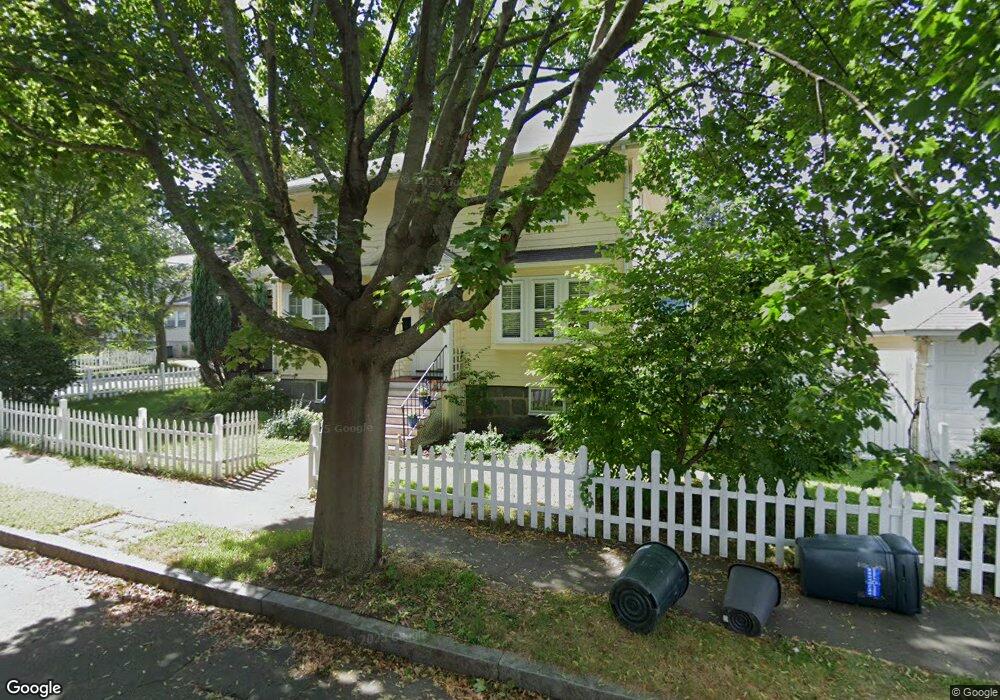
143 Everett St Quincy, MA 02170
West Quincy NeighborhoodEstimated Value: $735,000 - $800,000
4
Beds
2
Baths
1,596
Sq Ft
$478/Sq Ft
Est. Value
About This Home
This home is located at 143 Everett St, Quincy, MA 02170 and is currently estimated at $763,255, approximately $478 per square foot. 143 Everett St is a home located in Norfolk County with nearby schools including Wollaston School, Central Middle School, and North Quincy High School.
Ownership History
Date
Name
Owned For
Owner Type
Purchase Details
Closed on
Oct 14, 2011
Sold by
Quilty Kathleen V
Bought by
Fox James H and Fox Joanne L
Current Estimated Value
Home Financials for this Owner
Home Financials are based on the most recent Mortgage that was taken out on this home.
Original Mortgage
$292,500
Outstanding Balance
$200,934
Interest Rate
4.25%
Mortgage Type
Purchase Money Mortgage
Estimated Equity
$562,321
Create a Home Valuation Report for This Property
The Home Valuation Report is an in-depth analysis detailing your home's value as well as a comparison with similar homes in the area
Home Values in the Area
Average Home Value in this Area
Purchase History
| Date | Buyer | Sale Price | Title Company |
|---|---|---|---|
| Fox James H | $337,500 | -- |
Source: Public Records
Mortgage History
| Date | Status | Borrower | Loan Amount |
|---|---|---|---|
| Open | Fox James H | $292,500 |
Source: Public Records
Tax History
| Year | Tax Paid | Tax Assessment Tax Assessment Total Assessment is a certain percentage of the fair market value that is determined by local assessors to be the total taxable value of land and additions on the property. | Land | Improvement |
|---|---|---|---|---|
| 2025 | $8,029 | $696,400 | $390,500 | $305,900 |
| 2024 | $7,774 | $689,800 | $390,500 | $299,300 |
| 2023 | $7,243 | $650,800 | $371,900 | $278,900 |
| 2022 | $6,992 | $583,600 | $323,400 | $260,200 |
| 2021 | $6,785 | $558,900 | $308,000 | $250,900 |
| 2020 | $6,712 | $540,000 | $308,000 | $232,000 |
| 2019 | $6,392 | $509,300 | $287,900 | $221,400 |
| 2018 | $6,294 | $471,800 | $266,600 | $205,200 |
| 2017 | $6,242 | $440,500 | $253,900 | $186,600 |
| 2016 | $5,681 | $395,600 | $220,700 | $174,900 |
| 2015 | $5,279 | $361,600 | $200,700 | $160,900 |
| 2014 | $4,983 | $335,300 | $191,200 | $144,100 |
Source: Public Records
Map
Nearby Homes
- 154 N Central Ave
- 281 Elmwood Ave
- 17 Albany St
- 267-269 Farrington St
- 30 Elmwood Park
- 98 Safford St
- 10 Weston Ave Unit 322
- 149 Reservoir Rd
- 100 Grand View Ave Unit 9C
- 107 Fayette St
- 21 Robertson St
- 54 Safford St
- 0 Franklin St
- 41 Wallace Rd
- 72 Oakland Ave
- 20 Ellington Rd
- 163 Clay St Unit 3
- 440 Granite Ave Unit 201
- 19 Bass St
- 115 W Squantum St Unit 517
Your Personal Tour Guide
Ask me questions while you tour the home.