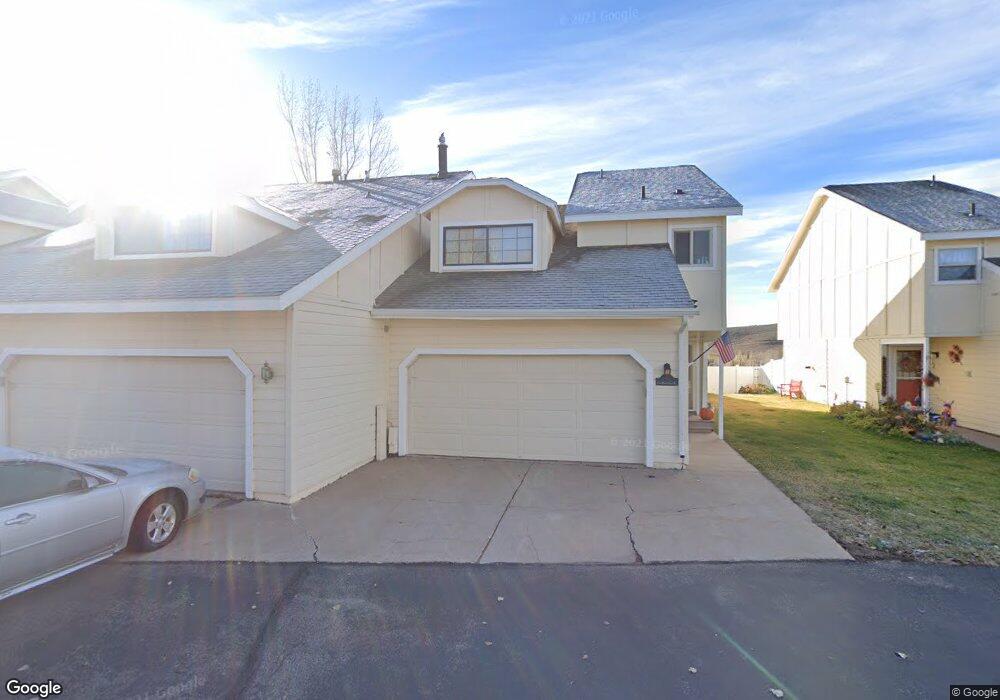
143 Fox Point Loop Rd Evanston, WY 82930
Estimated Value: $231,000 - $251,000
2
Beds
3
Baths
1,593
Sq Ft
$152/Sq Ft
Est. Value
About This Home
This home is located at 143 Fox Point Loop Rd, Evanston, WY 82930 and is currently estimated at $241,943, approximately $151 per square foot. 143 Fox Point Loop Rd is a home located in Uinta County with nearby schools including Evanston High School and Evanston Child Development Center.
Ownership History
Date
Name
Owned For
Owner Type
Purchase Details
Closed on
Nov 30, 2007
Sold by
Rosser Megan M
Bought by
Rosser Megan M and Megan M Rosser Trust
Current Estimated Value
Home Financials for this Owner
Home Financials are based on the most recent Mortgage that was taken out on this home.
Original Mortgage
$122,525
Outstanding Balance
$95,014
Interest Rate
6.27%
Mortgage Type
USDA
Estimated Equity
$146,929
Purchase Details
Closed on
Jun 15, 2006
Sold by
Harrell Sharon Marie
Bought by
Boes David H and Boes Joy E
Purchase Details
Closed on
Feb 6, 2006
Sold by
Harrell Sharon Marie and Harrell Fred B
Bought by
Harrell Sharon Marie
Create a Home Valuation Report for This Property
The Home Valuation Report is an in-depth analysis detailing your home's value as well as a comparison with similar homes in the area
Purchase History
| Date | Buyer | Sale Price | Title Company |
|---|---|---|---|
| Rosser Megan M | -- | None Available | |
| Rosser Megan M | -- | None Available | |
| Boes David H | -- | None Available | |
| Harrell Sharon Marie | -- | None Available |
Source: Public Records
Mortgage History
| Date | Status | Borrower | Loan Amount |
|---|---|---|---|
| Open | Rosser Megan M | $122,525 | |
| Closed | Rosser Megan M | $122,525 |
Source: Public Records
Tax History
| Year | Tax Paid | Tax Assessment Tax Assessment Total Assessment is a certain percentage of the fair market value that is determined by local assessors to be the total taxable value of land and additions on the property. | Land | Improvement |
|---|---|---|---|---|
| 2025 | $1,001 | $11,429 | $1,556 | $9,873 |
| 2024 | $1,001 | $14,733 | $2,075 | $12,658 |
| 2023 | $920 | $13,603 | $1,318 | $12,285 |
| 2022 | $721 | $10,590 | $1,106 | $9,484 |
| 2021 | $697 | $10,226 | $1,106 | $9,120 |
| 2020 | $736 | $10,800 | $1,034 | $9,766 |
| 2019 | $664 | $9,769 | $1,034 | $8,735 |
| 2018 | $0 | $8,377 | $920 | $7,457 |
| 2017 | $569 | $8,369 | $911 | $7,458 |
| 2016 | $568 | $8,345 | $911 | $7,434 |
| 2015 | -- | $10,149 | $911 | $9,238 |
| 2014 | -- | $9,757 | $0 | $0 |
Source: Public Records
Map
Nearby Homes
- 104 Windy Ridge Ct
- 213 Grandview Citcle
- 106 Grandview
- 214 City View Dr
- 193 Southridge Rd
- 209 Jared Ln
- 155 Spring Brook Dr
- 130 Skyline Dr
- 46 City View Dr
- 240 Darby Ln
- 113 Butterfield Rd
- 727 Sioux Dr
- 216 Toponce Dr
- 2921 Wyoming 150
- 48 Aspen Grove Aspen Grove Dr E O 10
- 130 Silver Sage Dr
- 132 Silver Sage Dr
- 105 Zuni Ct
- 200 S Valley Lot 7 Dr
- 200 S Valley Lot 12 Dr
- 141 Fox Point Loop Rd
- 145 Fox Point Loop Rd
- 141 Fox Point Loop
- 147 Fox Point Loop Rd
- 139 Fox Point Loop Rd
- 147 Fox Point
- 139 Fox Point Loop
- 137 Fox Point Loop Rd
- 149 Fox Point Loop Rd
- 135 Fox Point Loop Rd
- 151 Fox Point Loop Rd
- 201 Grand View Cir
- 201 Grand View Cir Unit Aspen Grove
- 153 Fox Point Loop
- 133 Fox Point Loop Rd
- 153 Fox Point Loop Rd
- 131 Fox Point Loop Rd
- 155 Fox Point Loop Rd
- 111 Windy Ridge Ct
- 162 Fox Point Loop Rd
Your Personal Tour Guide
Ask me questions while you tour the home.