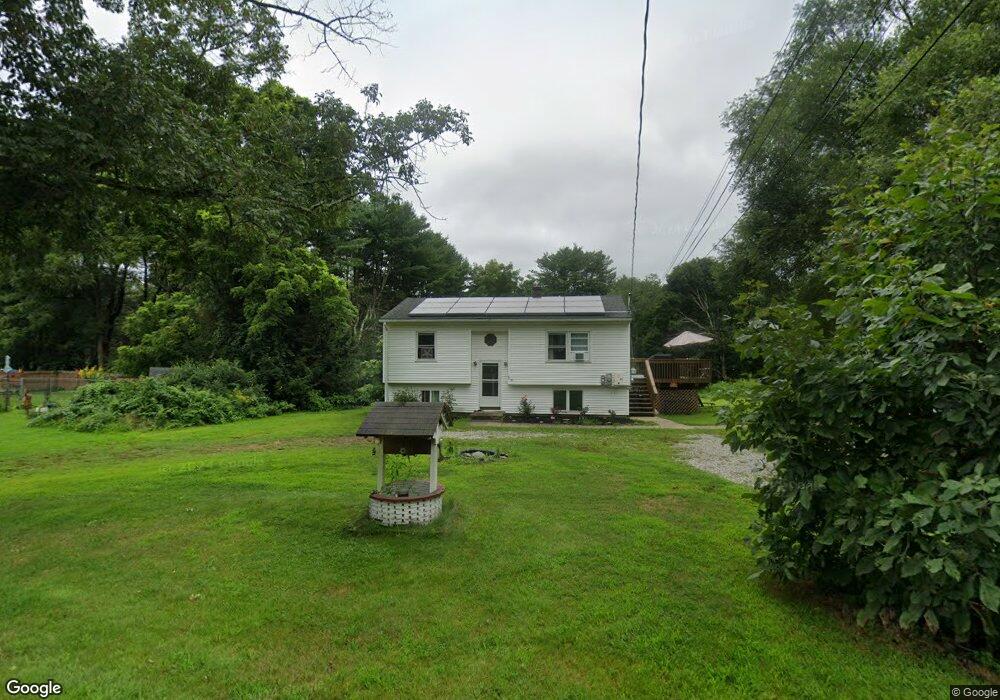
143 Green Hollow Rd Danielson, CT 06239
Estimated Value: $407,000 - $552,079
4
Beds
3
Baths
3,116
Sq Ft
$157/Sq Ft
Est. Value
About This Home
This home is located at 143 Green Hollow Rd, Danielson, CT 06239 and is currently estimated at $490,270, approximately $157 per square foot. 143 Green Hollow Rd is a home located in Windham County with nearby schools including Killingly Central School, Killingly Memorial School, and Killingly Intermediate School.
Ownership History
Date
Name
Owned For
Owner Type
Purchase Details
Closed on
Feb 12, 2019
Sold by
Usa Va
Bought by
Harris Allison
Current Estimated Value
Home Financials for this Owner
Home Financials are based on the most recent Mortgage that was taken out on this home.
Original Mortgage
$196,405
Outstanding Balance
$171,979
Interest Rate
4.5%
Mortgage Type
FHA
Estimated Equity
$318,291
Purchase Details
Closed on
Nov 26, 2018
Sold by
Usaa Fsb
Bought by
Usa Va
Purchase Details
Closed on
Jun 28, 2013
Sold by
Cusumano Christopher and Cusumano Deborah
Bought by
Bradley Thomas M and Bradley Amanda L
Home Financials for this Owner
Home Financials are based on the most recent Mortgage that was taken out on this home.
Original Mortgage
$278,869
Interest Rate
3.51%
Mortgage Type
New Conventional
Purchase Details
Closed on
Nov 13, 2003
Sold by
Peterman Jason M and Peterman Melissa A
Bought by
Cusumano Christopher and Cusumano Deborah
Purchase Details
Closed on
Aug 21, 2001
Sold by
Wojcik Kenneth J and Wojcik Linda D
Bought by
Peterman Jason M and Peterman Melissa A
Create a Home Valuation Report for This Property
The Home Valuation Report is an in-depth analysis detailing your home's value as well as a comparison with similar homes in the area
Home Values in the Area
Average Home Value in this Area
Purchase History
| Date | Buyer | Sale Price | Title Company |
|---|---|---|---|
| Harris Allison | $184,000 | -- | |
| Harris Allison | $184,000 | -- | |
| Usa Va | -- | -- | |
| Usaa Fsb | -- | -- | |
| Usa Va | -- | -- | |
| Bradley Thomas M | $273,000 | -- | |
| Bradley Thomas M | $273,000 | -- | |
| Cusumano Christopher | $250,000 | -- | |
| Cusumano Christopher | $250,000 | -- | |
| Peterman Jason M | $175,064 | -- | |
| Peterman Jason M | $175,064 | -- |
Source: Public Records
Mortgage History
| Date | Status | Borrower | Loan Amount |
|---|---|---|---|
| Open | Harris Allison | $196,405 | |
| Closed | Harris Allison | $196,405 | |
| Previous Owner | Peterman Jason M | $278,869 |
Source: Public Records
Tax History Compared to Growth
Tax History
| Year | Tax Paid | Tax Assessment Tax Assessment Total Assessment is a certain percentage of the fair market value that is determined by local assessors to be the total taxable value of land and additions on the property. | Land | Improvement |
|---|---|---|---|---|
| 2025 | $7,169 | $308,480 | $40,590 | $267,890 |
| 2024 | $6,820 | $308,480 | $40,590 | $267,890 |
| 2023 | $5,986 | $205,900 | $33,280 | $172,620 |
| 2022 | $5,623 | $205,730 | $33,110 | $172,620 |
| 2021 | $5,604 | $205,730 | $33,110 | $172,620 |
| 2020 | $5,501 | $205,730 | $33,110 | $172,620 |
| 2019 | $5,588 | $205,730 | $33,110 | $172,620 |
| 2017 | $4,894 | $170,450 | $22,610 | $147,840 |
| 2016 | $4,894 | $170,450 | $22,610 | $147,840 |
| 2015 | $4,894 | $170,450 | $22,610 | $147,840 |
| 2014 | $4,757 | $170,450 | $22,610 | $147,840 |
Source: Public Records
Map
Nearby Homes
- 69 Wauregan Rd
- 43 Fall Brook Rd
- 72 Dyer St
- 110 Franklin St
- 359 South St
- 405 South St
- 102 Cottage St
- 513 Lhomme Street Extension
- 72 Main St
- 37 Katherine Ave
- 24 Ventura Dr
- 51 Maple St
- 54 Ventura Dr
- 24 Center St
- 53 Ventura Dr
- 35 S Main St
- 80 Ventura Dr
- 53 S Main St
- 53 Proulx St
- 0 Providence Rd Unit 24080985
- 137 Green Hollow Rd
- 147 Green Hollow Rd
- 151 Green Hollow Rd
- 133 Green Hollow Rd
- 155 Green Hollow Rd
- 142 Green Hollow Rd
- 148 Green Hollow Rd
- 153 Green Hollow Rd
- 159 Green Hollow Rd
- 125 Green Hollow Rd
- 156 Green Hollow Rd
- 134 Green Hollow Rd
- 162 Green Hollow Rd
- 126 Green Hollow Rd
- 123 Green Hollow Rd
- 152 Green Hollow Rd
- 168 Green Hollow Rd
- 120 Green Hollow Rd
- 121 Green Hollow Rd
- 154 Green Hollow Rd