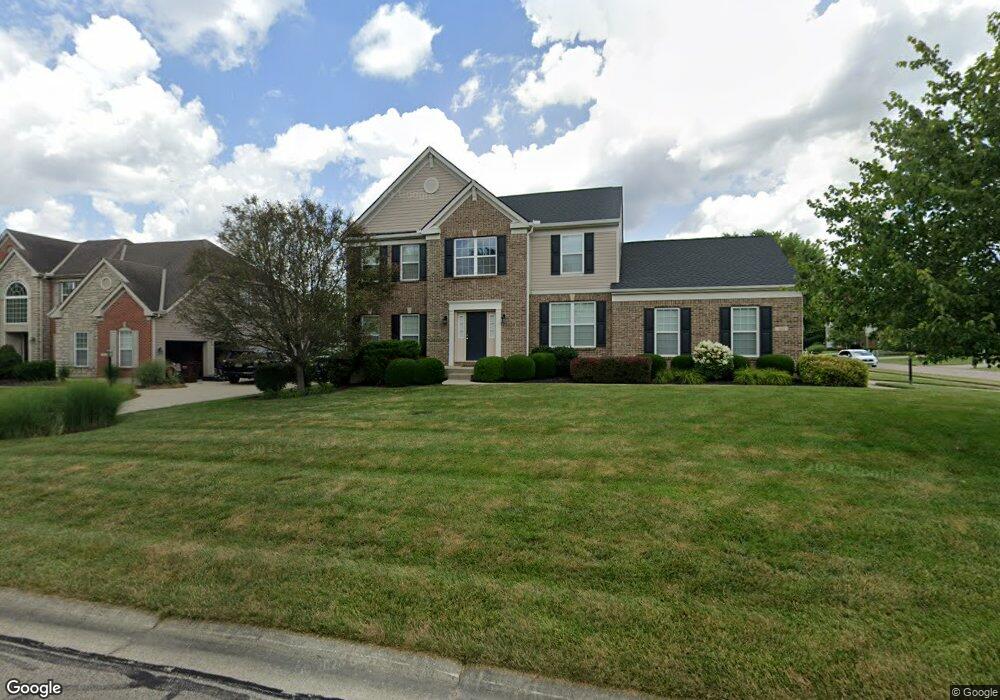
143 Hunting Fields Ln Loveland, OH 45140
Estimated Value: $522,582 - $551,000
4
Beds
3
Baths
2,102
Sq Ft
$257/Sq Ft
Est. Value
About This Home
This home is located at 143 Hunting Fields Ln, Loveland, OH 45140 and is currently estimated at $539,896, approximately $256 per square foot. 143 Hunting Fields Ln is a home located in Warren County with nearby schools including Little Miami Early Childhood Center, Little Miami Intermediate Middle School, and Little Miami Middle School.
Ownership History
Date
Name
Owned For
Owner Type
Purchase Details
Closed on
Feb 16, 2008
Sold by
Novak Mark R and Novak Pam L
Bought by
Antommattei Frances M and Sherwin Robert J
Current Estimated Value
Home Financials for this Owner
Home Financials are based on the most recent Mortgage that was taken out on this home.
Original Mortgage
$224,000
Interest Rate
6.09%
Mortgage Type
Purchase Money Mortgage
Purchase Details
Closed on
Feb 13, 2006
Sold by
The Drees Co
Bought by
Novak Mark R and Novak Pam L
Home Financials for this Owner
Home Financials are based on the most recent Mortgage that was taken out on this home.
Original Mortgage
$226,950
Interest Rate
6.37%
Mortgage Type
Fannie Mae Freddie Mac
Purchase Details
Closed on
Dec 3, 2004
Sold by
Brandywine Llc
Bought by
The Drees Co
Create a Home Valuation Report for This Property
The Home Valuation Report is an in-depth analysis detailing your home's value as well as a comparison with similar homes in the area
Home Values in the Area
Average Home Value in this Area
Purchase History
| Date | Buyer | Sale Price | Title Company |
|---|---|---|---|
| Antommattei Frances M | $280,000 | Chicago Title Cincinnati | |
| Novak Mark R | $284,533 | Classic Title Agency Llc | |
| The Drees Co | $89,166 | -- |
Source: Public Records
Mortgage History
| Date | Status | Borrower | Loan Amount |
|---|---|---|---|
| Previous Owner | Antommattei Frances M | $224,000 | |
| Previous Owner | Novak Mark R | $226,950 |
Source: Public Records
Tax History Compared to Growth
Tax History
| Year | Tax Paid | Tax Assessment Tax Assessment Total Assessment is a certain percentage of the fair market value that is determined by local assessors to be the total taxable value of land and additions on the property. | Land | Improvement |
|---|---|---|---|---|
| 2024 | $6,280 | $140,310 | $31,500 | $108,810 |
| 2023 | $5,132 | $105,283 | $15,960 | $89,323 |
| 2022 | $5,281 | $105,284 | $15,960 | $89,324 |
| 2021 | $4,854 | $105,284 | $15,960 | $89,324 |
| 2020 | $4,887 | $92,355 | $14,000 | $78,355 |
| 2019 | $5,032 | $92,355 | $14,000 | $78,355 |
| 2018 | $5,115 | $92,355 | $14,000 | $78,355 |
| 2017 | $4,405 | $79,377 | $12,240 | $67,137 |
| 2016 | $4,540 | $79,377 | $12,240 | $67,137 |
| 2015 | $4,547 | $79,377 | $12,240 | $67,137 |
| 2014 | $4,684 | $74,180 | $11,440 | $62,740 |
| 2013 | $4,489 | $90,800 | $14,000 | $76,800 |
Source: Public Records
Map
Nearby Homes
- Vaquero Plan at Chimney Ridge
- Lexington Plan at Chimney Ridge
- 19 Chimney Ridge Dr
- 28 Heath Ct
- 27 Heath Ct
- 209 W Decatur Ln
- 181 Eastbury Dr
- 103 Timber Cove
- 10549 S St Rt 48
- 436 E Loveland Ave
- 0 Ohio 48
- 222 Obannon Ave
- 446 Ohio Ave
- 0.87ac E Broadway St
- 102 Oak St
- 9900 Miami Dr
- 619 W Loveland Ave
- 621 W Loveland Ave
- 12143 Cedar Dr
- 12077 Maple Dr
- 144 Hunting Fields Ln
- 100 Gamekeepers Ln
- 106 Gamekeepers Ln
- 155 Hounds Run
- 142 Hunting Fields Ln
- 161 Hounds Run
- 136 Hunting Fields Ln
- 112 Gamekeepers Ln
- 130 Hunting Fields Ln
- 111 Gamekeepers Ln
- 100 Hounds Run
- 119 Gamekeepers Ln
- 142 Hounds Run
- 113 Gamekeepers Ln
- 148 Hounds Run
- 136 Hounds Run
- 124 Hunting Fields Ln
- 154 Hounds Run
- 118 Gamekeepers Ln
- 130 Hounds Run