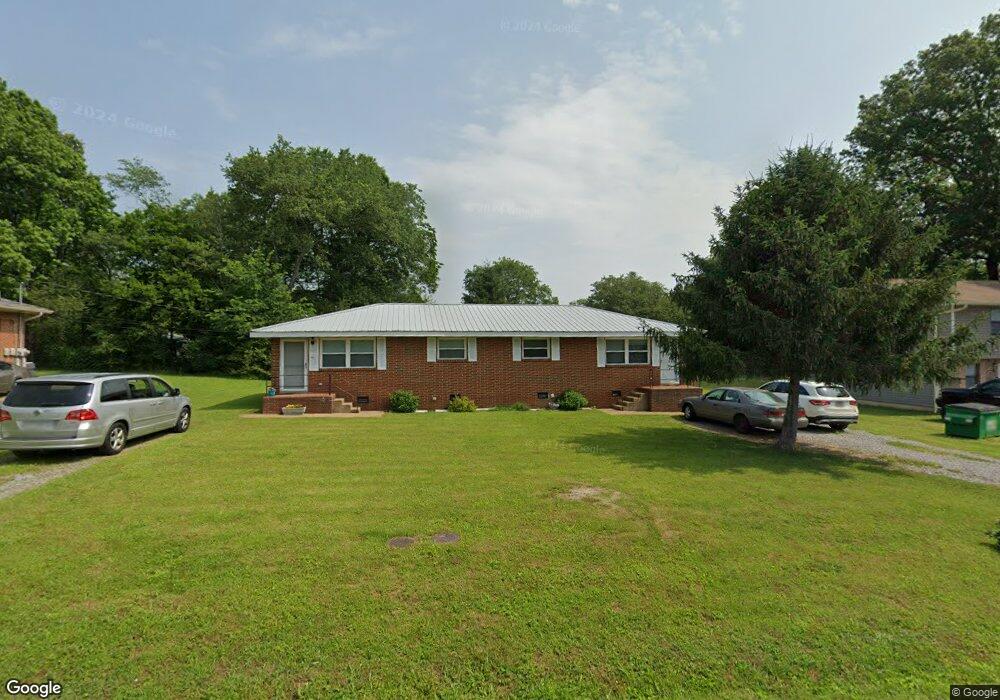
143 Kelley Ln Unit 1 Flintstone, GA 30725
Flintstone NeighborhoodEstimated Value: $175,836 - $296,000
Studio
2
Baths
1,792
Sq Ft
$129/Sq Ft
Est. Value
About This Home
This home is located at 143 Kelley Ln Unit 1, Flintstone, GA 30725 and is currently estimated at $231,709, approximately $129 per square foot. 143 Kelley Ln Unit 1 is a home located in Walker County with nearby schools including Chattanooga Valley Elementary School, Chattanooga Valley Middle School, and Ridgeland High School.
Ownership History
Date
Name
Owned For
Owner Type
Purchase Details
Closed on
Jul 31, 2018
Sold by
Oswald Rhonda Lynn
Bought by
Duble David Allen and Duble Joanna Ruth
Current Estimated Value
Home Financials for this Owner
Home Financials are based on the most recent Mortgage that was taken out on this home.
Original Mortgage
$104,500
Outstanding Balance
$89,608
Interest Rate
4.5%
Mortgage Type
New Conventional
Estimated Equity
$142,101
Purchase Details
Closed on
Feb 7, 2014
Sold by
Noblitt Brenda S
Bought by
Creekmore Larry D
Purchase Details
Closed on
Sep 29, 1976
Sold by
Carpenter Samuel G
Bought by
Noblitt Brenda S
Purchase Details
Closed on
Jul 9, 1974
Sold by
Douglass William H
Bought by
Carpenter Samuel G
Purchase Details
Closed on
Aug 7, 1969
Bought by
Douglass William H
Create a Home Valuation Report for This Property
The Home Valuation Report is an in-depth analysis detailing your home's value as well as a comparison with similar homes in the area
Home Values in the Area
Average Home Value in this Area
Purchase History
| Date | Buyer | Sale Price | Title Company |
|---|---|---|---|
| Duble David Allen | $110,000 | -- | |
| Creekmore Larry D | $31,500 | -- | |
| Noblitt Brenda S | $26,400 | -- | |
| Carpenter Samuel G | -- | -- | |
| Douglass William H | -- | -- |
Source: Public Records
Mortgage History
| Date | Status | Borrower | Loan Amount |
|---|---|---|---|
| Open | Duble David Allen | $104,500 |
Source: Public Records
Tax History
| Year | Tax Paid | Tax Assessment Tax Assessment Total Assessment is a certain percentage of the fair market value that is determined by local assessors to be the total taxable value of land and additions on the property. | Land | Improvement |
|---|---|---|---|---|
| 2025 | $1,494 | $63,496 | $3,621 | $59,875 |
| 2024 | $1,443 | $58,669 | $3,018 | $55,651 |
| 2023 | $1,406 | $55,765 | $3,018 | $52,747 |
| 2022 | $1,292 | $47,898 | $3,018 | $44,880 |
| 2021 | $1,131 | $37,001 | $1,810 | $35,191 |
| 2020 | $961 | $29,308 | $1,810 | $27,498 |
| 2019 | $977 | $29,308 | $1,810 | $27,498 |
| 2018 | $776 | $29,308 | $1,810 | $27,498 |
| 2017 | $917 | $29,308 | $1,810 | $27,498 |
| 2016 | $917 | $29,308 | $1,810 | $27,498 |
| 2015 | $717 | $19,852 | $2,352 | $17,500 |
| 2014 | $253 | $21,842 | $2,352 | $19,490 |
| 2013 | $776 | $21,842 | $2,352 | $19,490 |
Source: Public Records
Map
Nearby Homes
- 120 Williams Ave
- 427 John Thompson Rd
- 152 Carmack Rd
- 33 Brumby Rd
- 19 Turkey Run
- 244 Haven Hill Ln
- 16 Japonica St
- 196 North Ave
- 102 W Schmitt Rd
- 309 W Schmitt Rd
- 404 W Schmitt Rd
- 12 Mark Cir
- 4752 Happy Valley Rd
- 130 Cascade Dr
- 125 Cascade Dr
- 270 Cascade Dr
- 228 Cascade Dr
- 86 West Dr
- 52 Tower Dr
- 115 Crestline Dr
- 143 Kelley Ln
- 125 Kelley Ln
- 154 Kelley Ln
- 107 Kelley Ln
- 112 Kelley Ln
- 156 Williams Ave
- 136 Williams Ave
- 77 Kelley Ln
- 102 Williams Ave
- 92 Kelley Ln
- 132 Kelley Ln
- 78 Williams Ave
- 3858 Chattanooga Valley Rd
- 3844 Chattanooga Valley Rd
- 3874 Chattanooga Valley Rd
- 3806 Chattanooga Valley Rd
- 3888 Chattanooga Valley Rd
- 115 Williams Ave
- 135 Williams Ave
- 50 Williams Ave
Your Personal Tour Guide
Ask me questions while you tour the home.