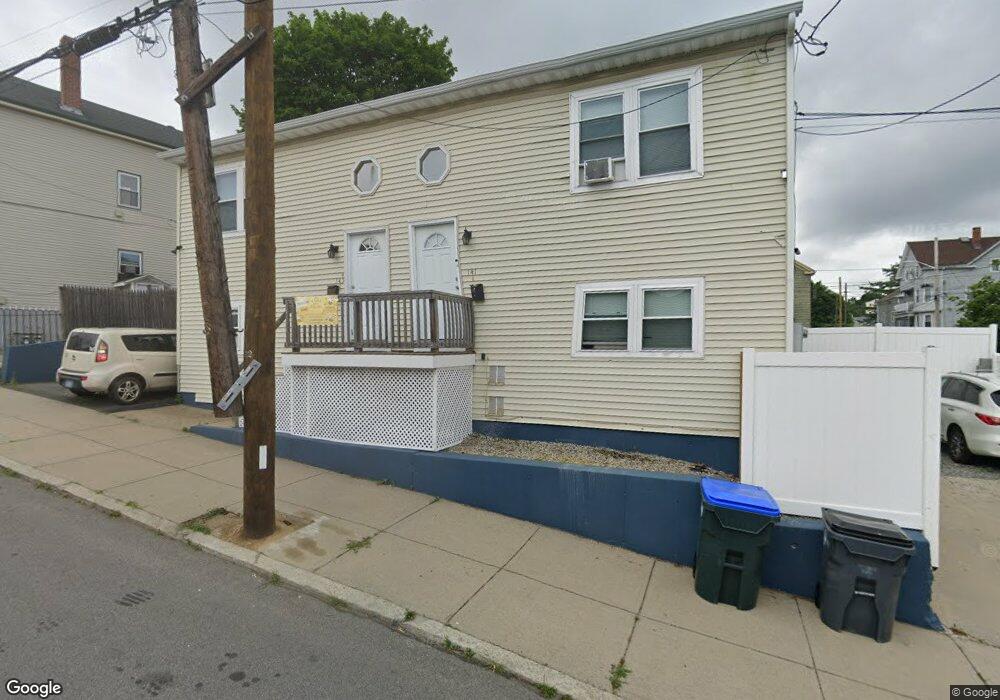
143 Magnolia St Providence, RI 02909
Silver Lake NeighborhoodEstimated Value: $461,000 - $624,000
4
Beds
4
Baths
2,912
Sq Ft
$188/Sq Ft
Est. Value
About This Home
This home is located at 143 Magnolia St, Providence, RI 02909 and is currently estimated at $547,510, approximately $188 per square foot. 143 Magnolia St is a home located in Providence County with nearby schools including Asa Messer Elementary School, Charles N. Fortes Elementary School, and Laurel Hill Annex School.
Ownership History
Date
Name
Owned For
Owner Type
Purchase Details
Closed on
Mar 21, 2002
Sold by
Heaton James E and Heaton Lois B
Bought by
Bonilla Enrique R and Bonilla Carmen M
Current Estimated Value
Home Financials for this Owner
Home Financials are based on the most recent Mortgage that was taken out on this home.
Original Mortgage
$76,000
Interest Rate
6.91%
Mortgage Type
Purchase Money Mortgage
Create a Home Valuation Report for This Property
The Home Valuation Report is an in-depth analysis detailing your home's value as well as a comparison with similar homes in the area
Home Values in the Area
Average Home Value in this Area
Purchase History
Date | Buyer | Sale Price | Title Company |
---|---|---|---|
Bonilla Enrique R | $120,500 | -- |
Source: Public Records
Mortgage History
Date | Status | Borrower | Loan Amount |
---|---|---|---|
Open | Bonilla Enrique R | $195,000 | |
Closed | Bonilla Enrique R | $76,000 |
Source: Public Records
Tax History Compared to Growth
Tax History
Year | Tax Paid | Tax Assessment Tax Assessment Total Assessment is a certain percentage of the fair market value that is determined by local assessors to be the total taxable value of land and additions on the property. | Land | Improvement |
---|---|---|---|---|
2024 | $5,476 | $298,400 | $71,300 | $227,100 |
2023 | $5,476 | $298,400 | $71,300 | $227,100 |
2022 | $5,312 | $298,400 | $71,300 | $227,100 |
2021 | $4,816 | $196,100 | $45,200 | $150,900 |
2020 | $4,816 | $196,100 | $45,200 | $150,900 |
2019 | $4,816 | $196,100 | $45,200 | $150,900 |
2018 | $4,542 | $142,100 | $43,900 | $98,200 |
2017 | $4,542 | $142,100 | $43,900 | $98,200 |
2016 | $4,542 | $142,100 | $43,900 | $98,200 |
2015 | $4,326 | $130,700 | $46,600 | $84,100 |
2014 | $4,411 | $130,700 | $46,600 | $84,100 |
2013 | $4,411 | $130,700 | $46,600 | $84,100 |
Source: Public Records
Map
Nearby Homes