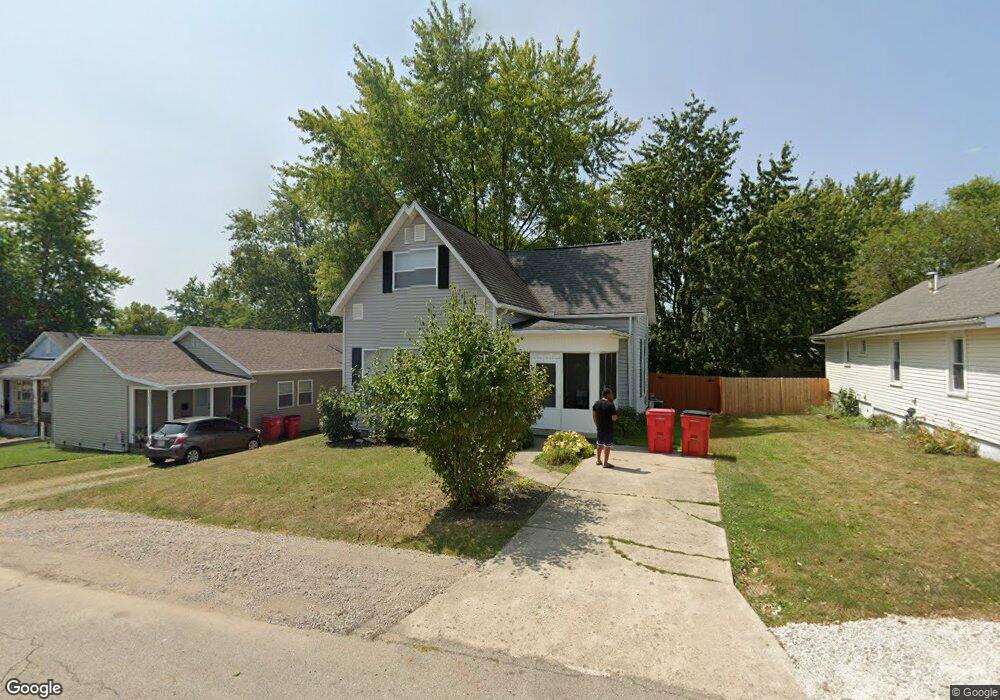
143 McLene Ave London, OH 43140
Estimated Value: $182,000 - $224,000
3
Beds
1
Bath
1,388
Sq Ft
$150/Sq Ft
Est. Value
About This Home
This home is located at 143 McLene Ave, London, OH 43140 and is currently estimated at $208,624, approximately $150 per square foot. 143 McLene Ave is a home located in Madison County with nearby schools including London Elementary School, London Middle School, and London High School.
Ownership History
Date
Name
Owned For
Owner Type
Purchase Details
Closed on
Jun 30, 2017
Sold by
The Secretary Of Housing & Urban Develop
Bought by
Paul Angelia Renee
Current Estimated Value
Purchase Details
Closed on
Nov 2, 2016
Sold by
Lakeview Loan Servicing Llc
Bought by
Secretary Of Housing & Urban Development
Purchase Details
Closed on
Sep 27, 2016
Sold by
Sullivan Jason P
Bought by
Lakeview Loan Servicing Llc
Purchase Details
Closed on
Jun 26, 2014
Sold by
Sullivan Jason P
Bought by
Sullivan Promys K
Purchase Details
Closed on
Jan 10, 2003
Sold by
Bennett Paul A
Bought by
Sullivan Jason P and Sullivan Promys K
Home Financials for this Owner
Home Financials are based on the most recent Mortgage that was taken out on this home.
Original Mortgage
$91,278
Interest Rate
6.23%
Mortgage Type
FHA
Purchase Details
Closed on
Feb 15, 1994
Sold by
Manning Elizabeth A
Bought by
Bennett Paul A
Create a Home Valuation Report for This Property
The Home Valuation Report is an in-depth analysis detailing your home's value as well as a comparison with similar homes in the area
Home Values in the Area
Average Home Value in this Area
Purchase History
| Date | Buyer | Sale Price | Title Company |
|---|---|---|---|
| Paul Angelia Renee | $52,000 | Midland Title | |
| Secretary Of Housing & Urban Development | -- | None Available | |
| Lakeview Loan Servicing Llc | $51,000 | None Available | |
| Sullivan Promys K | -- | None Available | |
| Sullivan Jason P | $92,000 | -- | |
| Bennett Paul A | $55,000 | -- |
Source: Public Records
Mortgage History
| Date | Status | Borrower | Loan Amount |
|---|---|---|---|
| Previous Owner | Sullivan Jason P | $91,278 |
Source: Public Records
Tax History Compared to Growth
Tax History
| Year | Tax Paid | Tax Assessment Tax Assessment Total Assessment is a certain percentage of the fair market value that is determined by local assessors to be the total taxable value of land and additions on the property. | Land | Improvement |
|---|---|---|---|---|
| 2024 | $1,608 | $51,200 | $10,510 | $40,690 |
| 2023 | $1,608 | $51,200 | $10,510 | $40,690 |
| 2022 | $1,195 | $34,820 | $7,470 | $27,350 |
| 2021 | $1,190 | $34,820 | $7,470 | $27,350 |
| 2020 | $1,191 | $34,820 | $7,470 | $27,350 |
| 2019 | $1,014 | $29,350 | $6,620 | $22,730 |
| 2018 | $1,101 | $29,350 | $6,620 | $22,730 |
| 2017 | $1,045 | $29,350 | $6,620 | $22,730 |
| 2016 | $1,051 | $28,900 | $6,620 | $22,280 |
| 2015 | $1,045 | $28,900 | $6,620 | $22,280 |
| 2014 | $1,205 | $28,900 | $6,620 | $22,280 |
| 2013 | -- | $27,920 | $6,580 | $21,340 |
Source: Public Records
Map
Nearby Homes
- 84 E 5th St
- 156 N Main St
- 44 E 4th St Unit 46
- 144 E High St
- 154 E High St
- 150 N Oak St
- 22 Willis Ave
- 661 Ohio 38
- 205 Lafayette St
- 321 Jacob Ln
- 292 N Main St
- 18 W Center St
- 40 S Cherry St
- 121 W Center St
- 233 Maddoxx Dr
- 345 Jacob Ln
- 347 Jacob Ln
- Ashton Plan at London Landing at Brooksedge
- Cooper Plan at London Landing at Brooksedge
- Walnut Plan at London Landing at Brooksedge
- 143 Mc Lene Ave
- 141 Mc Lene Ave
- 145 McLene Ave
- 141 McLene Ave
- 139 McLene Ave
- 135 McLene Ave
- 208 Park Ave
- 142 McLene Ave
- 142 Hawthorne Ave
- 150 McLene Ave
- 204 Park Ave
- 140 Hawthorne Ave
- 146 Hawthorne Ave
- 208 Park Ave
- 210 Park Ave
- 206 Park Ave
- 140 McLene Ave
- 140 McLene Ave
- 148 Hawthorne Ave
- 136 McLene Ave