143 N Main St Natick, MA 01760
Estimated Value: $672,000 - $714,000
3
Beds
1
Bath
1,416
Sq Ft
$488/Sq Ft
Est. Value
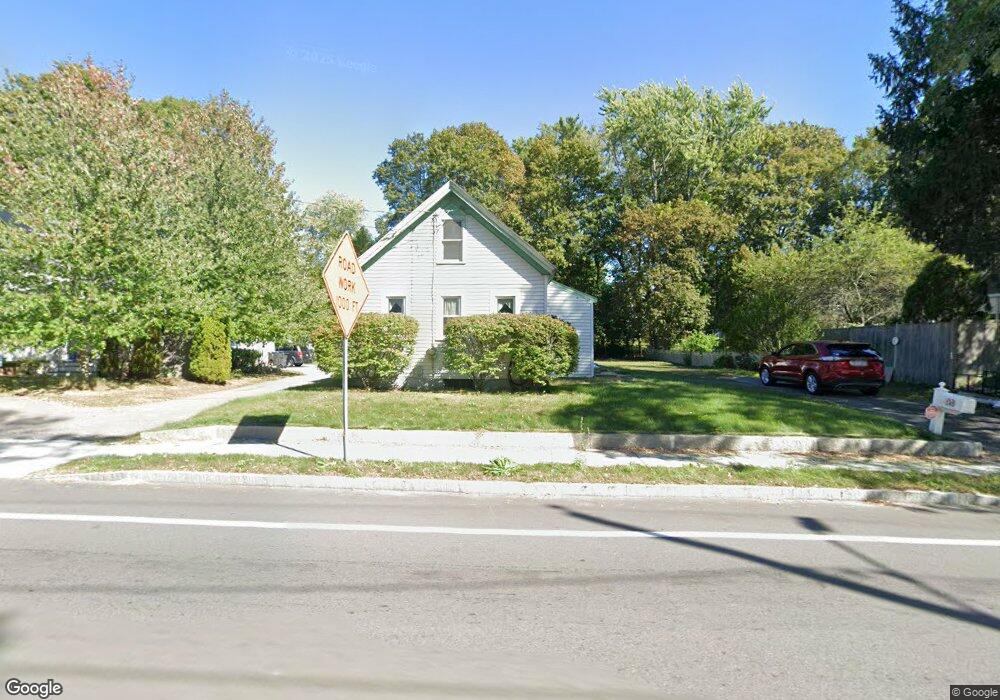
About This Home
This home is located at 143 N Main St, Natick, MA 01760 and is currently estimated at $690,440, approximately $487 per square foot. 143 N Main St is a home located in Middlesex County with nearby schools including Natick High School, Wilson Middle School, and Bennett-Hemenway (Ben-Hem) Elementary School.
Ownership History
Date
Name
Owned For
Owner Type
Purchase Details
Closed on
Dec 10, 1987
Sold by
143 Main St Rlty Tr
Bought by
Peckham Steven P
Current Estimated Value
Home Financials for this Owner
Home Financials are based on the most recent Mortgage that was taken out on this home.
Original Mortgage
$42,500
Interest Rate
10.96%
Purchase Details
Closed on
Mar 16, 1987
Sold by
Martin Henry F
Bought by
143 North Main St Rt
Home Financials for this Owner
Home Financials are based on the most recent Mortgage that was taken out on this home.
Original Mortgage
$109,650
Interest Rate
9.01%
Mortgage Type
Purchase Money Mortgage
Create a Home Valuation Report for This Property
The Home Valuation Report is an in-depth analysis detailing your home's value as well as a comparison with similar homes in the area
Home Values in the Area
Average Home Value in this Area
Purchase History
| Date | Buyer | Sale Price | Title Company |
|---|---|---|---|
| Peckham Steven P | $170,000 | -- | |
| 143 North Main St Rt | $129,000 | -- |
Source: Public Records
Mortgage History
| Date | Status | Borrower | Loan Amount |
|---|---|---|---|
| Closed | 143 North Main St Rt | $42,500 | |
| Closed | 143 North Main St Rt | $42,500 | |
| Closed | 143 North Main St Rt | $127,500 | |
| Previous Owner | 143 North Main St Rt | $109,650 |
Source: Public Records
Tax History
| Year | Tax Paid | Tax Assessment Tax Assessment Total Assessment is a certain percentage of the fair market value that is determined by local assessors to be the total taxable value of land and additions on the property. | Land | Improvement |
|---|---|---|---|---|
| 2025 | $5,738 | $479,800 | $384,200 | $95,600 |
| 2024 | $5,518 | $450,100 | $361,600 | $88,500 |
| 2023 | $5,443 | $430,600 | $347,900 | $82,700 |
| 2022 | $5,191 | $389,100 | $316,100 | $73,000 |
| 2021 | $7,169 | $380,200 | $298,100 | $82,100 |
| 2020 | $5,176 | $380,300 | $284,500 | $95,800 |
| 2019 | $4,834 | $380,300 | $284,500 | $95,800 |
| 2018 | $4,678 | $358,500 | $271,000 | $87,500 |
| 2017 | $4,145 | $307,300 | $230,700 | $76,600 |
| 2016 | $3,905 | $287,800 | $211,800 | $76,000 |
| 2015 | $3,893 | $281,700 | $211,800 | $69,900 |
Source: Public Records
Map
Nearby Homes
- 7 Jackson Ct Unit B
- 27 2nd St
- 43 Charles St
- 41 Charles St
- 293 Bacon St Unit A
- 9 Bellevue Rd
- 20 Florence St Unit B
- 142 Bacon St
- 38 Washington St Unit 38
- 16 Harvard St
- 49 Summer St
- 17 Florence St
- 58 W Central St
- 32 Harvard St
- 98 W Central St
- 63 Pond St
- 4 Richard Rd
- 3 Vale St Unit A
- 12 Bay State Rd
- 53 Harvard Street Extension
Your Personal Tour Guide
Ask me questions while you tour the home.