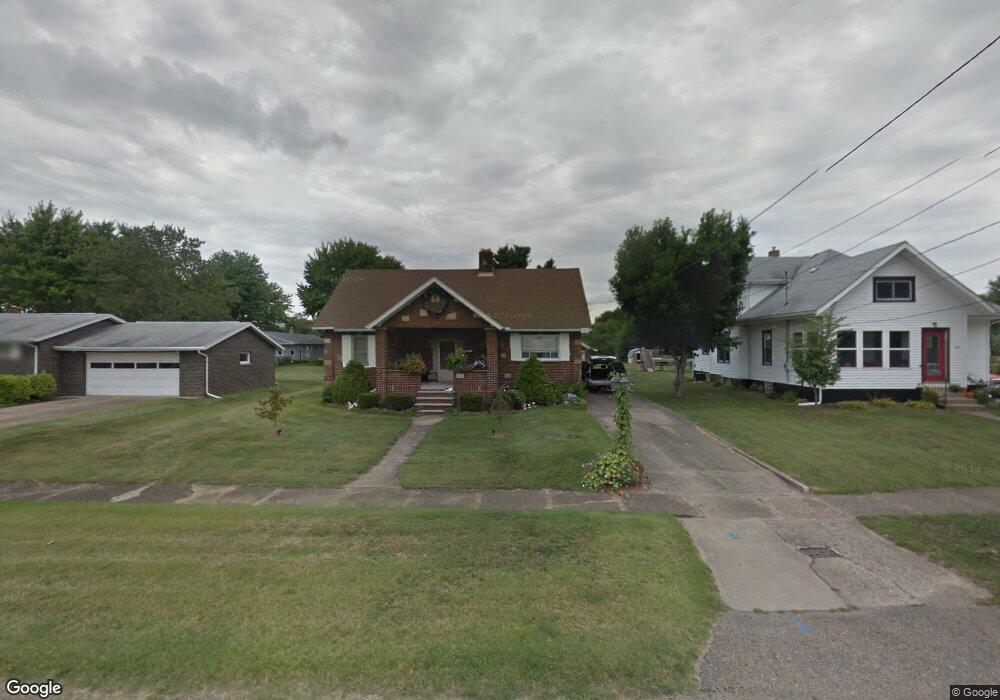
143 N Mckinley St Waynesburg, OH 44688
Estimated Value: $171,842 - $215,000
4
Beds
2
Baths
1,888
Sq Ft
$101/Sq Ft
Est. Value
About This Home
This home is located at 143 N Mckinley St, Waynesburg, OH 44688 and is currently estimated at $191,211, approximately $101 per square foot. 143 N Mckinley St is a home located in Stark County with nearby schools including Sandy Valley Elementary School, Sandy Valley Middle School, and Sandy Valley High School.
Ownership History
Date
Name
Owned For
Owner Type
Purchase Details
Closed on
Sep 27, 2016
Sold by
Frigyes James A and Frigyes Lucille A
Bought by
Frigyes James A and Arbaugh Dale W
Current Estimated Value
Home Financials for this Owner
Home Financials are based on the most recent Mortgage that was taken out on this home.
Original Mortgage
$46,213
Outstanding Balance
$5,804
Interest Rate
3.43%
Mortgage Type
Future Advance Clause Open End Mortgage
Estimated Equity
$185,407
Purchase Details
Closed on
Mar 16, 2011
Sold by
Mangus George P and Mangus Anne M
Bought by
Frigyes James A and Frigyes Lucille A
Home Financials for this Owner
Home Financials are based on the most recent Mortgage that was taken out on this home.
Original Mortgage
$65,315
Interest Rate
4.88%
Mortgage Type
Purchase Money Mortgage
Purchase Details
Closed on
Feb 23, 2011
Sold by
Mangus George A
Bought by
Mangus George P and Mangus Anne M
Home Financials for this Owner
Home Financials are based on the most recent Mortgage that was taken out on this home.
Original Mortgage
$65,315
Interest Rate
4.88%
Mortgage Type
Purchase Money Mortgage
Create a Home Valuation Report for This Property
The Home Valuation Report is an in-depth analysis detailing your home's value as well as a comparison with similar homes in the area
Home Values in the Area
Average Home Value in this Area
Purchase History
| Date | Buyer | Sale Price | Title Company |
|---|---|---|---|
| Frigyes James A | -- | None Available | |
| Frigyes James A | $84,900 | Attorney | |
| Mangus George P | -- | Attorney |
Source: Public Records
Mortgage History
| Date | Status | Borrower | Loan Amount |
|---|---|---|---|
| Open | Frigyes James A | $46,213 | |
| Closed | Frigyes James A | $65,315 |
Source: Public Records
Tax History Compared to Growth
Tax History
| Year | Tax Paid | Tax Assessment Tax Assessment Total Assessment is a certain percentage of the fair market value that is determined by local assessors to be the total taxable value of land and additions on the property. | Land | Improvement |
|---|---|---|---|---|
| 2025 | $1,178 | $48,580 | $10,570 | $38,010 |
| 2024 | -- | $48,580 | $10,570 | $38,010 |
| 2023 | $2,953 | $37,490 | $10,120 | $27,370 |
| 2022 | $1,890 | $37,490 | $10,120 | $27,370 |
| 2021 | $1,891 | $37,490 | $10,120 | $27,370 |
| 2020 | $1,746 | $33,220 | $8,720 | $24,500 |
| 2019 | $1,695 | $33,220 | $8,720 | $24,500 |
| 2018 | $1,701 | $33,220 | $8,720 | $24,500 |
| 2017 | $1,784 | $33,190 | $7,810 | $25,380 |
| 2016 | $1,768 | $31,650 | $7,810 | $23,840 |
| 2015 | $1,782 | $31,650 | $7,810 | $23,840 |
| 2014 | $1,557 | $25,100 | $6,200 | $18,900 |
| 2013 | $784 | $25,100 | $6,200 | $18,900 |
Source: Public Records
Map
Nearby Homes
- 0 W Lisbon St
- 156 W Lisbon St
- 8793 Elmfort Ave SE
- 0 Goodland St SE
- 7796 Mottice Dr SE
- 0 Elson St SE Unit 5130913
- 7750 Waynesburg Dr SE
- 7678 Waynesburg Dr SE
- 1.25 Ac Vacant Lot N Lynnwood Dr
- 614 Levee Cir
- 1.06 Ac Vacant Lot N Lynnwood Dr
- 217 E Carrollton St
- 5488 Elson St SE
- 5500 Westbrook St SE
- 6805 Waynesburg Dr SE
- 0 Ravenna Ave SE
- 3799 Westbrook St SE
- 9144 Malwayne Dr NW
- 3750 Farber St SE
- 7009 Bachelor Rd NW
- 149 N Mckinley St
- 133 N Mckinley St
- 153 N Mckinley St
- 0 Shane Ave Unit 3605369
- 0 Shane Ave Unit 3605361
- 0 Shane Ave Unit 3605357
- 0 Shane Ave Unit 3803021
- 0 Shane Ave Unit 3803010
- 0 Shane Ave Unit 3803002
- 0 Shane Ave Unit 3811808
- 0 Shane Ave Unit 3811797
- 0 Shane Ave Unit 3811759
- 144 Mckinley Ave
- 355 Shane Ave
- 119 S N Mckinley Ave
- 127 N Mckinley St
- 150 N Mckinley St
- 134 N Mckinley St
- 163 N Mckinley St
- 158 N Mckinley St