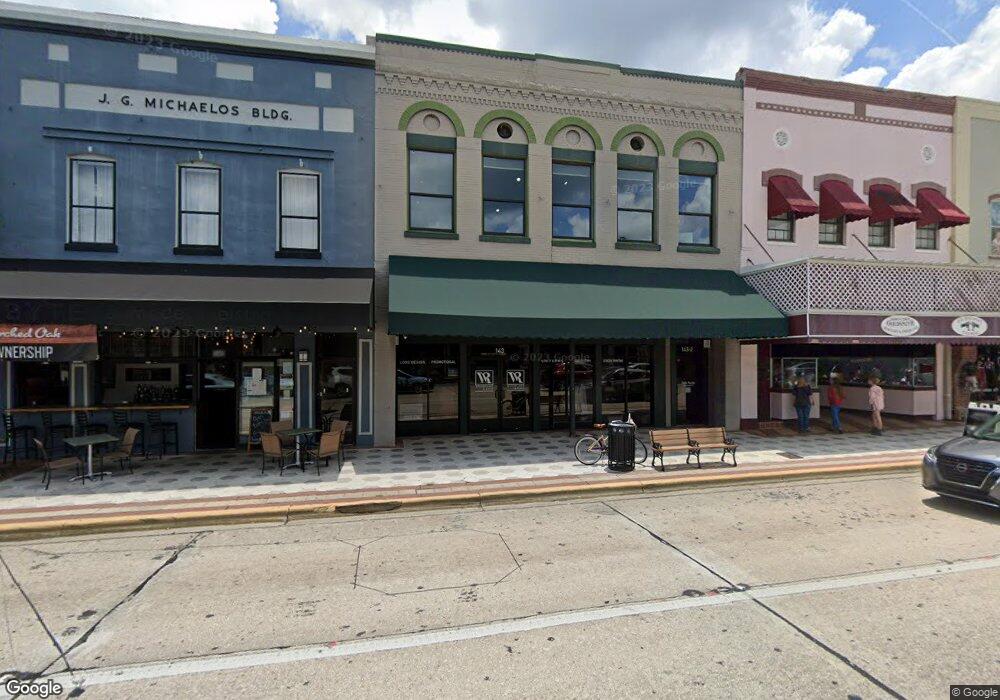
143 N Woodland Blvd Deland, FL 32720
Estimated Value: $1,186,866
--
Bed
4
Baths
5,775
Sq Ft
$206/Sq Ft
Est. Value
About This Home
This home is located at 143 N Woodland Blvd, Deland, FL 32720 and is currently estimated at $1,186,866, approximately $205 per square foot. 143 N Woodland Blvd is a home located in Volusia County with nearby schools including Blue Lake Elementary School, Deland High School, and Deland Middle School.
Ownership History
Date
Name
Owned For
Owner Type
Purchase Details
Closed on
Jun 3, 2022
Sold by
Underwood Acquisitions Llc
Bought by
Polar Bear Investment Fund Llc
Current Estimated Value
Home Financials for this Owner
Home Financials are based on the most recent Mortgage that was taken out on this home.
Original Mortgage
$650,000
Outstanding Balance
$617,609
Interest Rate
5.11%
Mortgage Type
New Conventional
Estimated Equity
$569,257
Purchase Details
Closed on
Sep 18, 2019
Sold by
Castle Harbor Holdings Llc
Bought by
Underwood Acquisitions Llc
Home Financials for this Owner
Home Financials are based on the most recent Mortgage that was taken out on this home.
Original Mortgage
$436,285
Interest Rate
3.6%
Mortgage Type
Stand Alone First
Purchase Details
Closed on
Jan 15, 1993
Bought by
Castle Harbor Holdings Inc
Purchase Details
Closed on
Feb 15, 1976
Bought by
Castle Harbor Holdings Inc
Create a Home Valuation Report for This Property
The Home Valuation Report is an in-depth analysis detailing your home's value as well as a comparison with similar homes in the area
Home Values in the Area
Average Home Value in this Area
Purchase History
| Date | Buyer | Sale Price | Title Company |
|---|---|---|---|
| Polar Bear Investment Fund Llc | $1,235,000 | None Listed On Document | |
| Underwood Acquisitions Llc | $561,000 | Attorney | |
| Castle Harbor Holdings Inc | $133,100 | -- | |
| Castle Harbor Holdings Inc | $46,000 | -- |
Source: Public Records
Mortgage History
| Date | Status | Borrower | Loan Amount |
|---|---|---|---|
| Open | Polar Bear Investment Fund Llc | $650,000 | |
| Previous Owner | Underwood Acquisitions Llc | $436,285 |
Source: Public Records
Tax History Compared to Growth
Tax History
| Year | Tax Paid | Tax Assessment Tax Assessment Total Assessment is a certain percentage of the fair market value that is determined by local assessors to be the total taxable value of land and additions on the property. | Land | Improvement |
|---|---|---|---|---|
| 2025 | $9,024 | $536,307 | $131,920 | $404,387 |
| 2024 | $9,024 | $520,228 | $131,920 | $388,308 |
| 2023 | $9,024 | $481,228 | $131,920 | $349,308 |
| 2022 | $7,288 | $433,234 | $115,430 | $317,804 |
| 2021 | $6,743 | $328,228 | $65,960 | $262,268 |
| 2020 | $6,940 | $336,769 | $65,960 | $270,809 |
| 2019 | $5,829 | $274,053 | $59,364 | $214,689 |
| 2018 | $5,492 | $243,996 | $59,364 | $184,632 |
| 2017 | $5,569 | $240,364 | $59,364 | $181,000 |
| 2016 | $5,081 | $232,146 | $0 | $0 |
| 2015 | $4,723 | $204,126 | $0 | $0 |
| 2014 | $4,435 | $191,214 | $0 | $0 |
Source: Public Records
Map
Nearby Homes
- 113 S Woodland Blvd
- 0 N Woodland Blvd Unit V4918224
- 333 E Church St
- 431 N Sans Souci Ave
- 125 W Voorhis Ave
- 205 E Voorhis Ave
- 404 N Clara Ave
- 334 W Howry Ave
- 0 Deland Unit R11052053
- 0 Deland Unit MFRV4942835
- 0 Deland Unit 1213697
- 47 Villa Villar Ct Unit 470
- 324 S Osceola St
- 135 S Arlington Ave
- 210 W University Ave
- 524 E Church St
- 5 Villa Villar Ct Unit 50
- 35 Villa Villar Ct Unit 35
- 351 S Osceola St
- 615 N Palmetto Ct
- 143 N Woodland Blvd Unit Suite 2
- 143 N Woodland Blvd Unit 1st floor
- 139 N Woodland Blvd
- 114 E Rich Ave Unit C
- 114 E Rich Ave Unit A
- 124 E Rich Ave
- 132 N Woodland Blvd
- 134 N Woodland Blvd
- 136 N Woodland Blvd
- 124 N Woodland Blvd
- 111 E Rich Ave
- 115 E Rich Ave
- 207 N Woodland Blvd
- 206 N Woodland Blvd
- 111 W Indiana Ave
- 119 N Woodland Blvd
- 128 E Rich Ave
- 117 N Woodland Blvd
- 125 E Indiana Ave
- 115 W Rich Ave