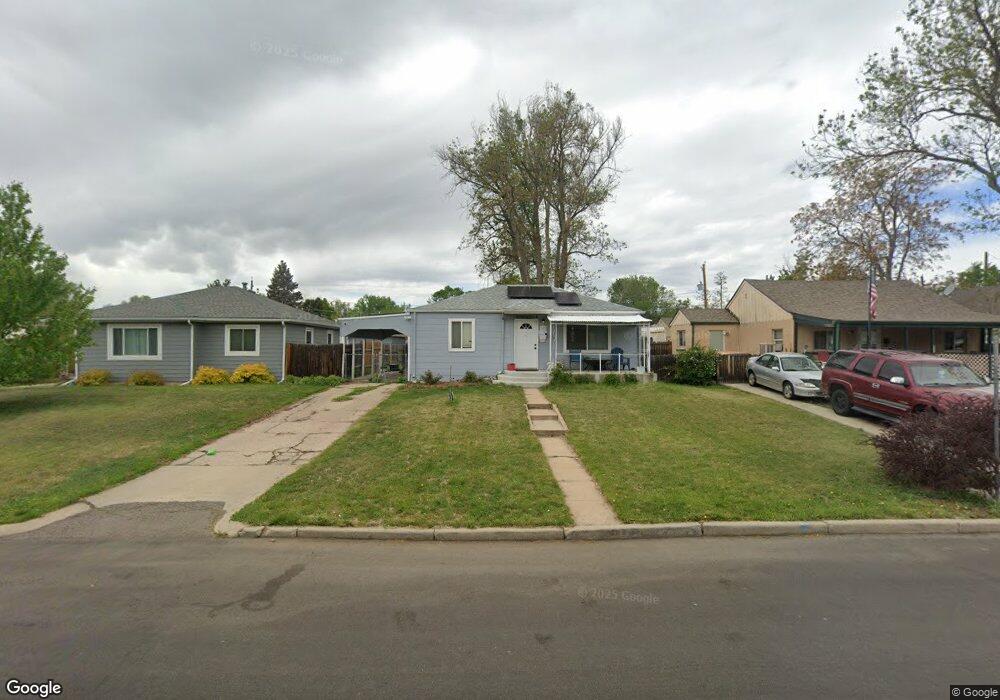
143 Raleigh St Denver, CO 80219
Barnum NeighborhoodEstimated Value: $355,000 - $417,000
2
Beds
1
Bath
809
Sq Ft
$479/Sq Ft
Est. Value
About This Home
This home is located at 143 Raleigh St, Denver, CO 80219 and is currently estimated at $387,588, approximately $479 per square foot. 143 Raleigh St is a home located in Denver County with nearby schools including Newlon Elementary School, Kepner Beacon Middle School, and West High School.
Ownership History
Date
Name
Owned For
Owner Type
Purchase Details
Closed on
Feb 19, 2021
Sold by
Pigman Mary M and Estate Of Gary Todd Hunter
Bought by
Ortega Leonardo Angel
Current Estimated Value
Home Financials for this Owner
Home Financials are based on the most recent Mortgage that was taken out on this home.
Original Mortgage
$358,000
Outstanding Balance
$319,914
Interest Rate
2.65%
Mortgage Type
VA
Estimated Equity
$67,674
Purchase Details
Closed on
Dec 12, 2001
Sold by
Parker Susan H
Bought by
Hunter Gary Todd
Home Financials for this Owner
Home Financials are based on the most recent Mortgage that was taken out on this home.
Original Mortgage
$144,952
Interest Rate
6.52%
Mortgage Type
FHA
Purchase Details
Closed on
Feb 28, 1997
Sold by
Froehler Paul C and Froehler Phillip
Bought by
Parker Susan H
Home Financials for this Owner
Home Financials are based on the most recent Mortgage that was taken out on this home.
Original Mortgage
$63,053
Interest Rate
7.88%
Create a Home Valuation Report for This Property
The Home Valuation Report is an in-depth analysis detailing your home's value as well as a comparison with similar homes in the area
Home Values in the Area
Average Home Value in this Area
Purchase History
| Date | Buyer | Sale Price | Title Company |
|---|---|---|---|
| Ortega Leonardo Angel | $358,000 | Heritage Title Company | |
| Hunter Gary Todd | $147,000 | -- | |
| Parker Susan H | $65,000 | First American Heritage Titl |
Source: Public Records
Mortgage History
| Date | Status | Borrower | Loan Amount |
|---|---|---|---|
| Open | Ortega Leonardo Angel | $358,000 | |
| Previous Owner | Hunter Gary Todd | $144,952 | |
| Previous Owner | Parker Susan H | $63,053 |
Source: Public Records
Tax History Compared to Growth
Tax History
| Year | Tax Paid | Tax Assessment Tax Assessment Total Assessment is a certain percentage of the fair market value that is determined by local assessors to be the total taxable value of land and additions on the property. | Land | Improvement |
|---|---|---|---|---|
| 2024 | $1,923 | $24,280 | $6,780 | $17,500 |
| 2023 | $1,881 | $24,280 | $6,780 | $17,500 |
| 2022 | $1,724 | $21,680 | $6,940 | $14,740 |
| 2021 | $1,724 | $22,310 | $7,140 | $15,170 |
| 2020 | $1,468 | $19,790 | $5,810 | $13,980 |
| 2019 | $1,427 | $19,790 | $5,810 | $13,980 |
| 2018 | $1,171 | $15,130 | $5,400 | $9,730 |
| 2017 | $1,167 | $15,130 | $5,400 | $9,730 |
| 2016 | $978 | $11,990 | $4,474 | $7,516 |
| 2015 | $937 | $11,990 | $4,474 | $7,516 |
| 2014 | $615 | $7,400 | $2,985 | $4,415 |
Source: Public Records
Map
Nearby Homes