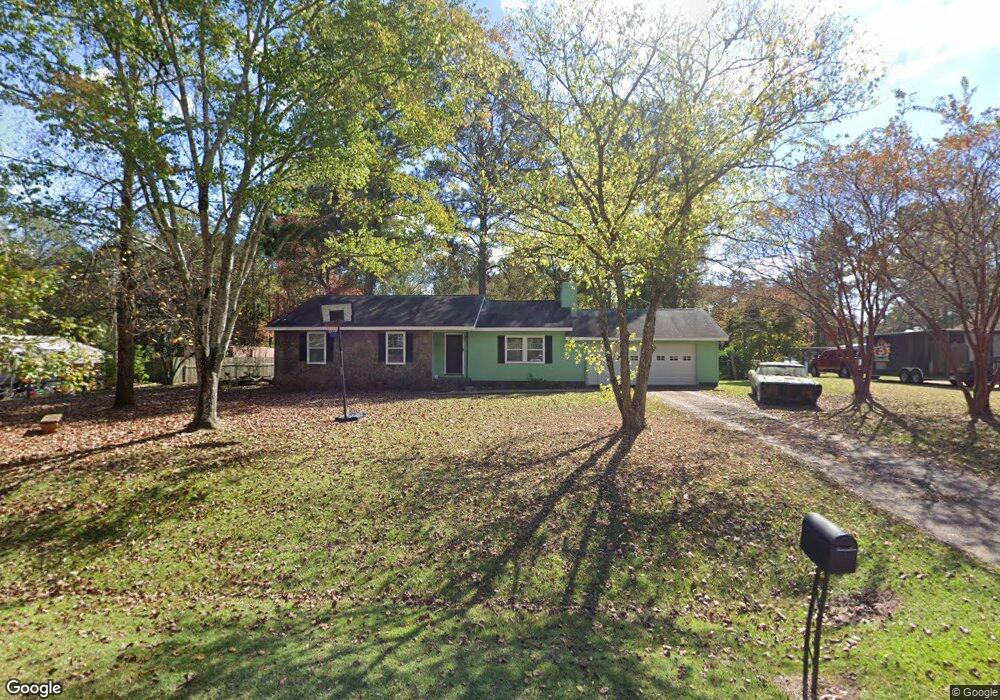
143 Rob Roy Rd Lagrange, GA 30240
Estimated Value: $176,000 - $215,000
3
Beds
2
Baths
1,256
Sq Ft
$158/Sq Ft
Est. Value
About This Home
This home is located at 143 Rob Roy Rd, Lagrange, GA 30240 and is currently estimated at $198,365, approximately $157 per square foot. 143 Rob Roy Rd is a home located in Troup County with nearby schools including Long Cane Elementary School, Berta Weathersbee Elementary School, and Whitesville Road Elementary School.
Ownership History
Date
Name
Owned For
Owner Type
Purchase Details
Closed on
Aug 17, 2010
Sold by
Meacham Matthew R
Bought by
Meacham Matthew R
Current Estimated Value
Home Financials for this Owner
Home Financials are based on the most recent Mortgage that was taken out on this home.
Original Mortgage
$93,865
Outstanding Balance
$60,782
Interest Rate
4.37%
Mortgage Type
FHA
Estimated Equity
$137,583
Purchase Details
Closed on
Dec 30, 1996
Sold by
Betty Joan Hester By Ex
Bought by
Meacham Matthew R
Purchase Details
Closed on
Apr 14, 1992
Bought by
Betty Joan Hester By Ex
Purchase Details
Closed on
Feb 1, 1988
Purchase Details
Closed on
Jun 21, 1979
Purchase Details
Closed on
Oct 20, 1978
Purchase Details
Closed on
Sep 29, 1978
Purchase Details
Closed on
Sep 25, 1978
Purchase Details
Closed on
May 30, 1975
Create a Home Valuation Report for This Property
The Home Valuation Report is an in-depth analysis detailing your home's value as well as a comparison with similar homes in the area
Purchase History
| Date | Buyer | Sale Price | Title Company |
|---|---|---|---|
| Meacham Matthew R | -- | -- | |
| Meacham Matthew R | $47,000 | -- | |
| Betty Joan Hester By Ex | $63,000 | -- | |
| -- | -- | -- | |
| -- | $41,800 | -- | |
| -- | -- | -- | |
| -- | -- | -- | |
| -- | -- | -- | |
| -- | -- | -- |
Source: Public Records
Mortgage History
| Date | Status | Borrower | Loan Amount |
|---|---|---|---|
| Open | Meacham Matthew R | $93,865 |
Source: Public Records
Tax History
| Year | Tax Paid | Tax Assessment Tax Assessment Total Assessment is a certain percentage of the fair market value that is determined by local assessors to be the total taxable value of land and additions on the property. | Land | Improvement |
|---|---|---|---|---|
| 2025 | $1,713 | $68,840 | $14,000 | $54,840 |
| 2024 | $1,513 | $57,480 | $14,000 | $43,480 |
| 2023 | $1,533 | $58,200 | $14,000 | $44,200 |
| 2022 | $1,387 | $51,680 | $10,000 | $41,680 |
| 2021 | $1,086 | $38,000 | $10,000 | $28,000 |
| 2020 | $965 | $34,000 | $6,000 | $28,000 |
| 2019 | $1,002 | $35,200 | $6,000 | $29,200 |
| 2018 | $846 | $30,040 | $6,000 | $24,040 |
| 2017 | $846 | $30,040 | $6,000 | $24,040 |
| 2016 | $822 | $29,224 | $6,000 | $23,224 |
| 2015 | $778 | $27,736 | $6,000 | $21,736 |
| 2014 | $745 | $26,592 | $6,000 | $20,592 |
| 2013 | -- | $27,658 | $6,000 | $21,658 |
Source: Public Records
Map
Nearby Homes
- 105 Redwood Dr
- 0 Hanson Dr Unit 10641272
- 275 Hanson Dr
- 22 Freeman Rd
- 0 Glass Bridge Rd Unit 10679358
- 640 Hudson Rd
- 266 Glass Bridge Rd
- 808 S Fling Rd
- 0 Bradfield Dr Unit 10568803
- 8 Horace Carter Rd
- 509 Connie Dr
- 427 Fling Rd
- 119 Plymouth Dr
- 124 Foxdale Dr
- 102 Bridgewater Dr
- 113 Colonial Ct Unit 100
- 104 Bridlewood Dr
- 311 Cumberland Dr
- 0 Cannonville Rd
- 101 Ivy Springs Dr
- 145 Rob Roy Rd
- 147 Rob Roy Rd
- 142 Rob Roy Rd
- 5038 Old West Point Rd
- 146 Rob Roy Rd
- 5036 Old West Point Rd
- 140 Rob Roy Rd
- 5036 Old Point W
- 5034 Old West Point Rd
- 5040 Old West Point Rd
- 137 Rob Roy Rd
- 40 Maefield Dr
- 5032 Old West Point Rd
- 76 Maefield Dr
- 5042 Old West Point Rd
- 5030 Old West Point Rd
- 136 Rob Roy Rd
- 135 Rob Roy Rd
- 5037 Old West Point Rd
- 5028 Old West Point Rd
Your Personal Tour Guide
Ask me questions while you tour the home.