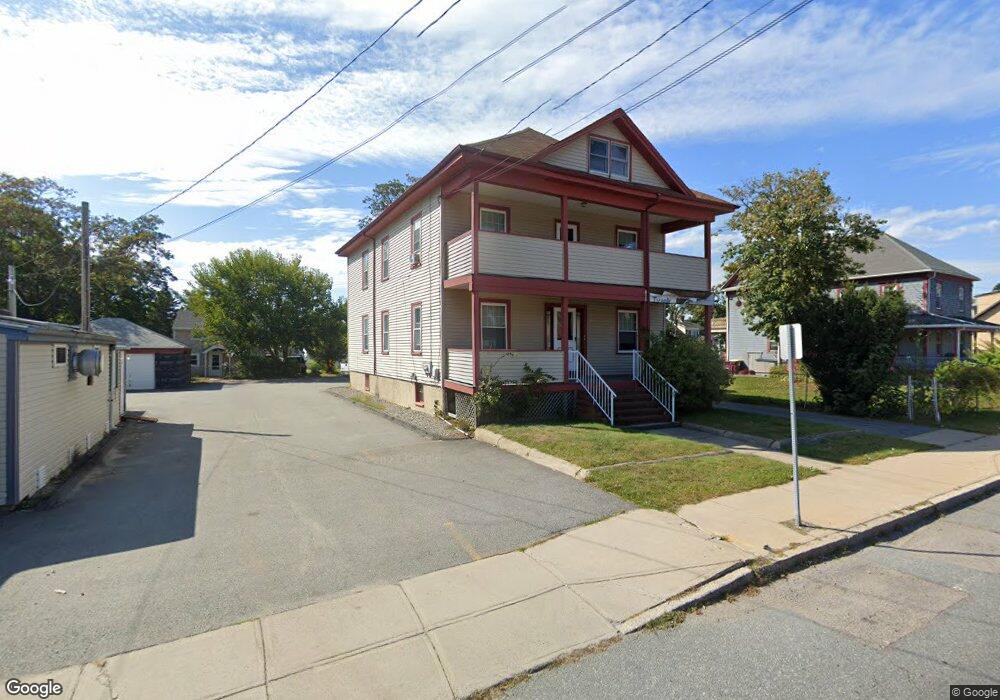
143 S Main St Acushnet, MA 02743
Estimated Value: $231,000 - $473,085
Studio
2
Baths
2,640
Sq Ft
$135/Sq Ft
Est. Value
About This Home
This home is located at 143 S Main St, Acushnet, MA 02743 and is currently estimated at $356,271, approximately $134 per square foot. 143 S Main St is a home located in Bristol County with nearby schools including Acushnet Elementary School, Albert F Ford Middle School, and Alma Del Mar Charter School.
Ownership History
Date
Name
Owned For
Owner Type
Purchase Details
Closed on
Mar 15, 2021
Sold by
Douglas C Baker Ret and Baker
Bought by
Elderkin Katie E
Current Estimated Value
Home Financials for this Owner
Home Financials are based on the most recent Mortgage that was taken out on this home.
Original Mortgage
$213,750
Outstanding Balance
$191,612
Interest Rate
2.7%
Mortgage Type
Purchase Money Mortgage
Estimated Equity
$164,659
Purchase Details
Closed on
Oct 18, 2019
Sold by
143 S Main Street Rt and Baker
Bought by
Douglas C Baker Ret 2019 and Baker
Purchase Details
Closed on
Dec 15, 2010
Sold by
Castonguay Roland and Baker Douglas C
Bought by
Baker Tr Douglas C and Baker Lynn I
Purchase Details
Closed on
Oct 7, 2010
Sold by
Younger Wayne and Scully Kathleen
Bought by
Baker Tr Douglas C and Baker Lynn I
Purchase Details
Closed on
May 21, 2009
Sold by
Castonguay Roland
Bought by
Baker Douglas C and Baker Lynn I
Create a Home Valuation Report for This Property
The Home Valuation Report is an in-depth analysis detailing your home's value as well as a comparison with similar homes in the area
Home Values in the Area
Average Home Value in this Area
Purchase History
We collect this data history from publicly available records. To have your information removed, we recommend requesting removal directly through your county’s website.
| Date | Buyer | Sale Price | Title Company |
|---|---|---|---|
| Elderkin Katie E | $285,000 | None Available | |
| Douglas C Baker Ret 2019 | -- | -- | |
| Baker Tr Douglas C | -- | -- | |
| Baker Tr Douglas C | $108,000 | -- | |
| Baker Douglas C | -- | -- |
Source: Public Records
Mortgage History
We collect this data history from publicly available records. To have your information removed, we recommend requesting removal directly through your county’s website.
| Date | Status | Borrower | Loan Amount |
|---|---|---|---|
| Open | Elderkin Katie E | $213,750 |
Source: Public Records
Tax History
| Year | Tax Paid | Tax Assessment Tax Assessment Total Assessment is a certain percentage of the fair market value that is determined by local assessors to be the total taxable value of land and additions on the property. | Land | Improvement |
|---|---|---|---|---|
| 2025 | $46 | $426,500 | $90,500 | $336,000 |
| 2024 | $4,307 | $377,500 | $86,300 | $291,200 |
| 2023 | $3,727 | $310,600 | $77,900 | $232,700 |
| 2022 | $3,852 | $290,300 | $73,700 | $216,600 |
| 2021 | $3,665 | $265,000 | $73,700 | $191,300 |
| 2020 | $3,583 | $257,000 | $73,700 | $183,300 |
| 2019 | $3,524 | $248,500 | $65,200 | $183,300 |
| 2018 | $3,583 | $248,500 | $65,200 | $183,300 |
| 2017 | $3,473 | $240,500 | $65,200 | $175,300 |
| 2016 | $3,349 | $230,500 | $65,200 | $165,300 |
| 2015 | $3,292 | $230,500 | $65,200 | $165,300 |
Source: Public Records
Map
Nearby Homes
Your Personal Tour Guide
Ask me questions while you tour the home.