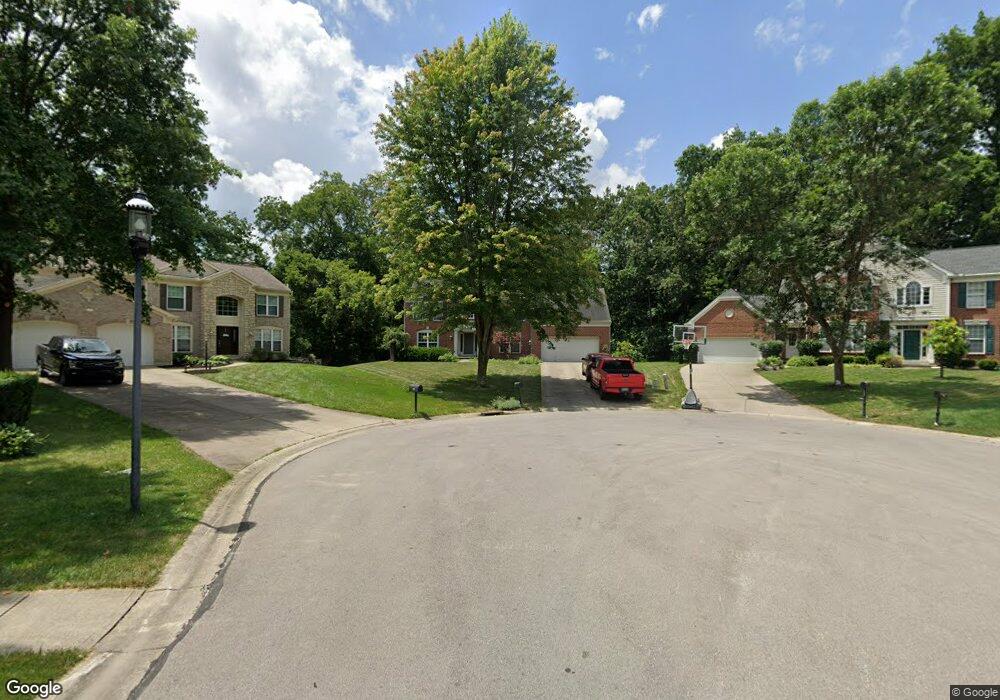
143 Silver Fox Ct Loveland, OH 45140
Estimated Value: $547,000 - $599,000
4
Beds
3
Baths
2,564
Sq Ft
$221/Sq Ft
Est. Value
About This Home
This home is located at 143 Silver Fox Ct, Loveland, OH 45140 and is currently estimated at $566,216, approximately $220 per square foot. 143 Silver Fox Ct is a home located in Warren County with nearby schools including Little Miami Early Childhood Center, Little Miami Intermediate Middle School, and Little Miami Middle School.
Ownership History
Date
Name
Owned For
Owner Type
Purchase Details
Closed on
May 4, 2006
Sold by
Belman Alexis V B
Bought by
Geohegan Stephen P and Geohegan Robin C
Current Estimated Value
Home Financials for this Owner
Home Financials are based on the most recent Mortgage that was taken out on this home.
Original Mortgage
$220,000
Outstanding Balance
$128,432
Interest Rate
6.54%
Mortgage Type
Fannie Mae Freddie Mac
Estimated Equity
$437,784
Purchase Details
Closed on
Aug 22, 2005
Sold by
Belman John C
Bought by
Belman Alexis V B
Purchase Details
Closed on
Dec 9, 1998
Sold by
Fischer Single Family Ho
Bought by
Belman John C and Belman Alexis V
Home Financials for this Owner
Home Financials are based on the most recent Mortgage that was taken out on this home.
Original Mortgage
$195,292
Interest Rate
6.93%
Mortgage Type
New Conventional
Purchase Details
Closed on
Aug 14, 1998
Sold by
Brandywine On The Little
Bought by
Fischer Single Family Homes Inc
Create a Home Valuation Report for This Property
The Home Valuation Report is an in-depth analysis detailing your home's value as well as a comparison with similar homes in the area
Home Values in the Area
Average Home Value in this Area
Purchase History
| Date | Buyer | Sale Price | Title Company |
|---|---|---|---|
| Geohegan Stephen P | $280,000 | Landamerica | |
| Belman Alexis V B | -- | -- | |
| Belman John C | $244,115 | -- | |
| Fischer Single Family Homes Inc | $98,400 | -- |
Source: Public Records
Mortgage History
| Date | Status | Borrower | Loan Amount |
|---|---|---|---|
| Open | Geohegan Stephen P | $220,000 | |
| Previous Owner | Belman John C | $195,292 |
Source: Public Records
Tax History Compared to Growth
Tax History
| Year | Tax Paid | Tax Assessment Tax Assessment Total Assessment is a certain percentage of the fair market value that is determined by local assessors to be the total taxable value of land and additions on the property. | Land | Improvement |
|---|---|---|---|---|
| 2024 | $6,466 | $144,460 | $31,500 | $112,960 |
| 2023 | $5,294 | $108,608 | $15,960 | $92,648 |
| 2022 | $5,447 | $108,609 | $15,960 | $92,649 |
| 2021 | $5,007 | $108,609 | $15,960 | $92,649 |
| 2020 | $5,041 | $95,270 | $14,000 | $81,270 |
| 2019 | $5,191 | $95,270 | $14,000 | $81,270 |
| 2018 | $5,255 | $95,270 | $14,000 | $81,270 |
| 2017 | $4,544 | $81,886 | $12,240 | $69,647 |
| 2016 | $4,683 | $81,886 | $12,240 | $69,647 |
| 2015 | $4,690 | $81,886 | $12,240 | $69,647 |
| 2014 | $4,832 | $76,530 | $11,440 | $65,090 |
| 2013 | $4,631 | $93,670 | $14,000 | $79,670 |
Source: Public Records
Map
Nearby Homes
- 209 W Decatur Ln
- 27 Heath Ct
- 28 Heath Ct
- Vaquero Plan at Chimney Ridge
- Lexington Plan at Chimney Ridge
- 19 Chimney Ridge Dr
- 181 Eastbury Dr
- 103 Timber Cove
- 10549 S St Rt 48
- 9900 Miami Dr
- 0 Birch Dr
- 12143 Cedar Dr
- 9653 Shore Dr
- 12077 Maple Dr
- 446 Ohio Ave
- 2515 Hickory Rd
- 2513 Hickory Rd
- 2423 Hickory Rd
- A Rich Rd
- 9613 Vine Dr
- 142 Silver Fox Ct
- 137 Silver Fox Ct
- 130 Bonnie Heath Cir
- 129 Bonnie Heath Cir
- 131 Silver Fox Ct
- 136 Silver Fox Ct
- 125 Silver Fox Ct
- 124 Bonnie Heath Cir
- 123 Bonnie Heath Cir Unit 130
- 130 Silver Fox Ct
- 124 Silver Fox Ct
- 217 Silver Fox Ct
- 118 Silver Fox Ct
- 118 Bonnie Heath Cir
- 119 Silver Fox Ct
- 205 Silver Fox Ct
- 117 Bonnie Heath Cir
- 136 Hawks Ridge Cir
- 112 Silver Fox Ct
- 112 Bonnie Heath Cir