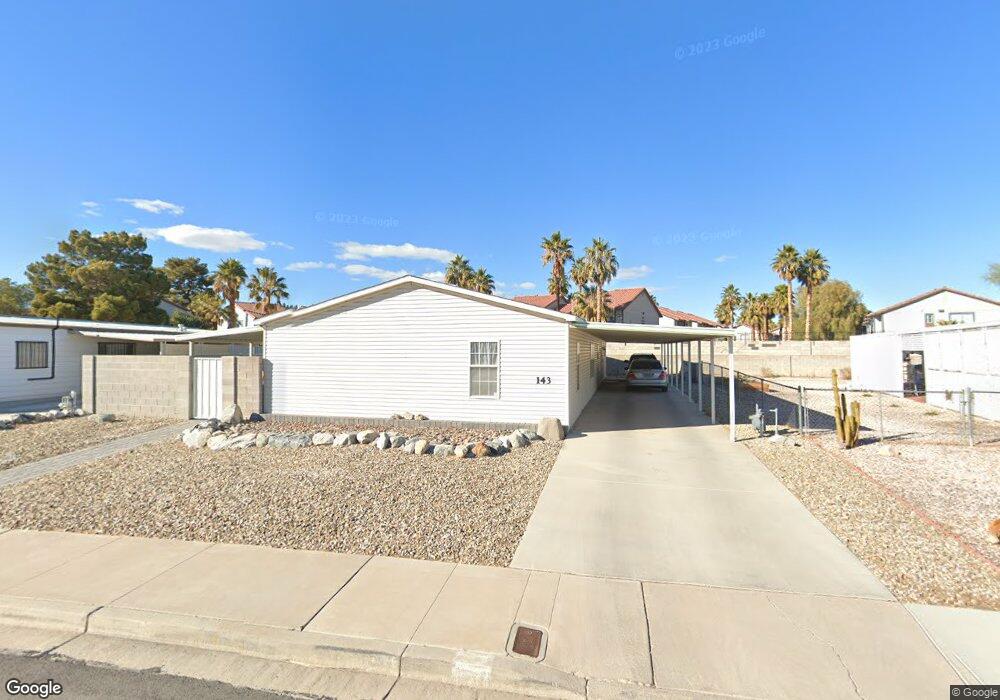
143 Sir George Dr Las Vegas, NV 89110
Estimated Value: $276,000 - $368,000
3
Beds
2
Baths
1,976
Sq Ft
$160/Sq Ft
Est. Value
About This Home
This home is located at 143 Sir George Dr, Las Vegas, NV 89110 and is currently estimated at $315,333, approximately $159 per square foot. 143 Sir George Dr is a home located in Clark County with nearby schools including Charlotte & Jerry Keller Elementary School, Richard J. Rundle Elementary School, and Duane D. Keller Middle School.
Ownership History
Date
Name
Owned For
Owner Type
Purchase Details
Closed on
Nov 25, 1997
Sold by
Purisima Jose P and Purisima Harriet
Bought by
Allison Karl A and Allison Cindy H
Current Estimated Value
Home Financials for this Owner
Home Financials are based on the most recent Mortgage that was taken out on this home.
Original Mortgage
$55,350
Interest Rate
7.13%
Mortgage Type
Construction
Purchase Details
Closed on
Jul 15, 1997
Sold by
Land Title Of Nevada Inc
Bought by
Purisima Jose P and Purisima Harriet
Purchase Details
Closed on
Jun 24, 1995
Sold by
Purisima Jose P and Purisima Harriett
Bought by
Morton James A and Morton Jeanne M
Home Financials for this Owner
Home Financials are based on the most recent Mortgage that was taken out on this home.
Original Mortgage
$58,000
Interest Rate
7.92%
Mortgage Type
Seller Take Back
Create a Home Valuation Report for This Property
The Home Valuation Report is an in-depth analysis detailing your home's value as well as a comparison with similar homes in the area
Home Values in the Area
Average Home Value in this Area
Purchase History
| Date | Buyer | Sale Price | Title Company |
|---|---|---|---|
| Allison Karl A | $25,500 | Old Republic Title Company | |
| Purisima Jose P | $64,565 | Land Title | |
| Morton James A | $68,000 | Land Title |
Source: Public Records
Mortgage History
| Date | Status | Borrower | Loan Amount |
|---|---|---|---|
| Previous Owner | Allison Karl A | $55,350 | |
| Previous Owner | Morton James A | $58,000 |
Source: Public Records
Tax History Compared to Growth
Tax History
| Year | Tax Paid | Tax Assessment Tax Assessment Total Assessment is a certain percentage of the fair market value that is determined by local assessors to be the total taxable value of land and additions on the property. | Land | Improvement |
|---|---|---|---|---|
| 2025 | $613 | $80,463 | $22,400 | $58,063 |
| 2024 | $596 | $80,463 | $22,400 | $58,063 |
| 2023 | $596 | $72,527 | $18,550 | $53,977 |
| 2022 | $586 | $64,714 | $14,700 | $50,014 |
| 2021 | $572 | $61,187 | $13,650 | $47,537 |
| 2020 | $550 | $59,059 | $12,250 | $46,809 |
| 2019 | $534 | $56,045 | $9,800 | $46,245 |
| 2018 | $519 | $53,283 | $8,400 | $44,883 |
| 2017 | $1,170 | $43,408 | $6,650 | $36,758 |
| 2016 | $491 | $41,157 | $5,250 | $35,907 |
| 2015 | $491 | $41,779 | $4,900 | $36,879 |
| 2014 | $476 | $23,874 | $4,200 | $19,674 |
Source: Public Records
Map
Nearby Homes
- 179 Sir George Dr
- 136 Sir George Dr
- 153 Sir Thomas Dr
- 130 Bel Port Dr Unit 133
- 280 Sir Phillip St
- 140 Sir David Way
- 5330 E Charleston Blvd Unit 2
- 5330 E Charleston Blvd Unit 113
- 332 Sir Jeffery Cir
- 111 Sir Arthur Dr
- 147 N Christy Ln
- 360 Sir Richard Dr E
- 0 E Charleston Blvd
- 5564 Orchard Ln Unit 133
- 4928 Ronan Dr
- 1200 Pleasant Brook St
- 5600 Orchard Ln
- 1224 Pleasant Brook St
- 5583 Orchard Ln Unit 152
- 5364 Awbury Ave
- 141 Sir George Dr
- 139 Sir George Dr
- 168 Sir George Dr
- 140 Sir George Dr
- 192 Sir George Dr
- 135 Sir George Dr
- 155 Sir Thomas Dr
- 132 Sir George Dr
- 215 Sir George Dr
- 130 Sir George Dr
- 216 Sir George Dr
- 199 Betty Ln
- 131 Sir George Dr Unit 2
- 241 Sir William Way
- 227 Sir William Way
- 128 Sir George Dr
- 150 Sir Thomas Dr
- 150 Sir Thomas Dr Unit None