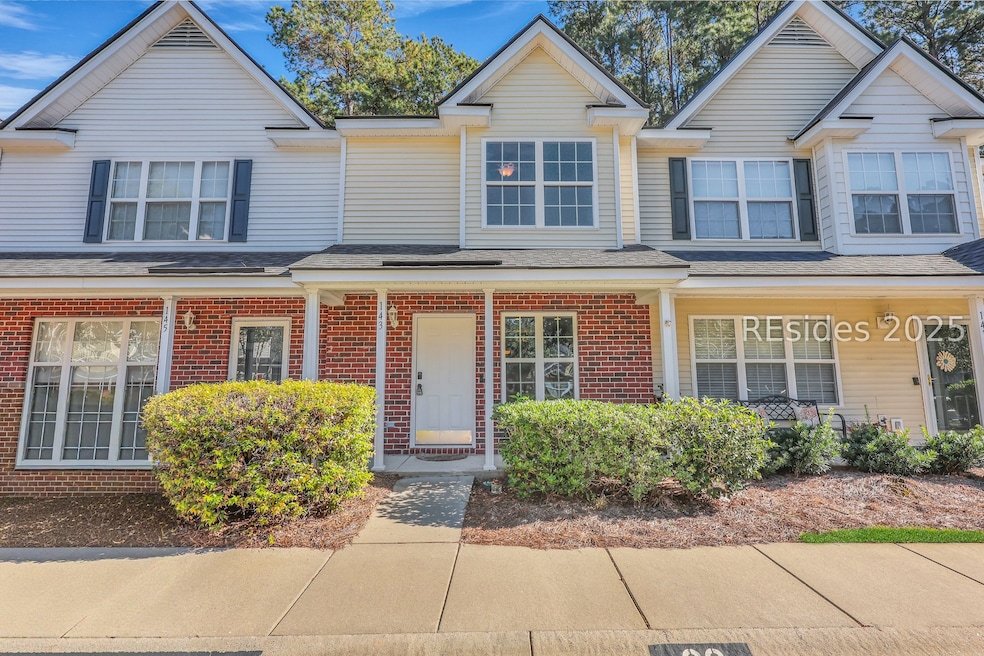
143 South St Unit 2 Bluffton, SC 29910
Estimated payment $1,275/month
Highlights
- Two Primary Bedrooms
- View of Trees or Woods
- Community Pool
- River Ridge Academy Rated A-
- Engineered Wood Flooring
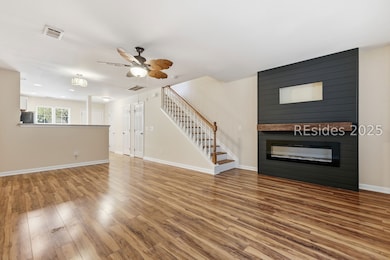
- Fireplace
About This Home
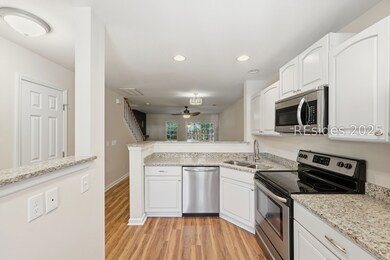
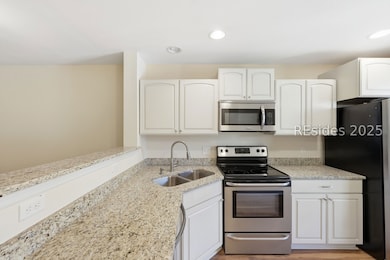
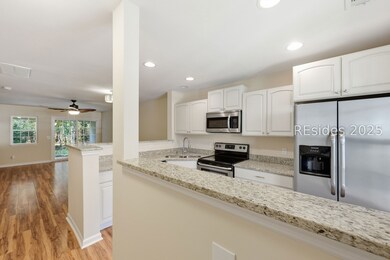
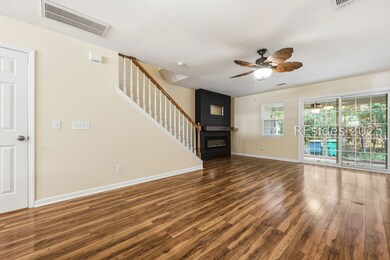
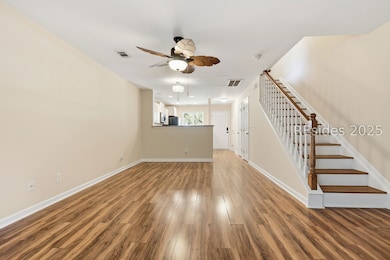
Discover the perfect blend of comfort, convenience, and coastal Lowcountry charm at 143 South St, a beautifully maintained 2-bedroom, 2.5-bath townhouse ideally situated just minutes from the ever-popular Washington Square in Bluffton. This premier location places you in the heart of one of Bluffton's most sought-after areas, known for its inviting atmosphere, vibrant local businesses, and easy access to dining, shopping, and entertainment.From the moment you step inside, you'll feel right at home. The main living area offers a warm and welcoming ambiance, featuring a cozy fireplace that creates the perfect focal point for relaxing evenings and gatherings with friends. Newly installed plush carpeting brings a fresh, comfortable feel throughout the home.The upgraded kitchen is designed for both functionality and style, complete with modern finishes, ample cabinetry, and generous counter space-ideal for preparing meals, hosting guests, or enjoying quiet mornings with a cup of coffee.Upstairs, you'll find two spacious bedrooms, each offering the privacy of its own en-suite bathroom. Whether accommodating residents, guests, or a home office, this thoughtful layout provides flexibility for a variety of lifestyles. A main-level half bath adds additional convenience for daily living and entertaining.Enjoy the benefits of low-maintenance townhouse living without sacrificing comfort or style. This property is perfectly suited for those seeking a primary residence, a Bluffton getaway, or a smart investment opportunity in a location that continues to grow in demand.
Townhouse Details
Home Type
- Townhome
Year Built
- Built in 2005
Lot Details
- Northwest Facing Home
Parking
- Assigned Parking
Home Design
- Split Level Home
- Brick Exterior Construction
- Asphalt Roof
- Vinyl Siding
- Tile
Interior Spaces
- 1,056 Sq Ft Home
- Smooth Ceilings
- Fireplace
- Insulated Windows
- Entrance Foyer
- Family Room
- Dining Room
- Storage Room
- Utility Room
- Views of Woods
Kitchen
- Range
- Dishwasher
Flooring
- Engineered Wood
- Carpet
Bedrooms and Bathrooms
- 2 Bedrooms
- Double Master Bedroom
Laundry
- Laundry Room
- Dryer
- Washer
Outdoor Features
- Outdoor Storage
- Front Porch
Utilities
- Central Heating and Cooling System
- Heat Pump System
Listing and Financial Details
- Tax Lot 21
- Assessor Parcel Number R610 030 000 1158 0000
Community Details
Overview
- The Townes At Buckwalter Subdivision
Recreation
- Community Pool
Map
Home Values in the Area
Average Home Value in this Area
Tax History
| Year | Tax Paid | Tax Assessment Tax Assessment Total Assessment is a certain percentage of the fair market value that is determined by local assessors to be the total taxable value of land and additions on the property. | Land | Improvement |
|---|---|---|---|---|
| 2024 | $1,461 | $8,636 | $1,280 | $7,356 |
| 2023 | $1,462 | $8,636 | $1,280 | $7,356 |
| 2022 | $1,065 | $5,800 | $1,280 | $4,520 |
| 2021 | $1,057 | $5,800 | $1,280 | $4,520 |
| 2020 | $1,053 | $5,800 | $1,280 | $4,520 |
| 2019 | $1,017 | $5,800 | $1,280 | $4,520 |
| 2018 | $2,360 | $8,700 | $0 | $0 |
| 2017 | $545 | $2,940 | $0 | $0 |
| 2016 | $544 | $2,940 | $0 | $0 |
| 2014 | -- | $2,940 | $0 | $0 |
Property History
| Date | Event | Price | List to Sale | Price per Sq Ft |
|---|---|---|---|---|
| 11/26/2025 11/26/25 | Pending | -- | -- | -- |
| 11/17/2025 11/17/25 | For Sale | $219,900 | -- | $208 / Sq Ft |
Purchase History
| Date | Type | Sale Price | Title Company |
|---|---|---|---|
| Warranty Deed | $225,000 | Mikkelson Law Firm Llc | |
| Warranty Deed | $145,000 | None Available | |
| Deed | $30,010 | -- | |
| Special Warranty Deed | $129,565 | None Available |
Mortgage History
| Date | Status | Loan Amount | Loan Type |
|---|---|---|---|
| Previous Owner | $130,500 | New Conventional | |
| Previous Owner | $127,464 | FHA |
Source: REsides
MLS Number: 502836
APN: R610-030-000-1158-0000
Disclaimer: Certain information contained herein is derived from information provided by parties other than Homes.com. All information provided is deemed reliable, but is not guaranteed to be accurate and should be independently verified.
![]() We do not attempt to independently verify the currency, completeness, accuracy or authenticity of the data contained herein. All area measurements and calculations are approximate and should be independently verified. Data may be subject to transcription and transmission errors. Accordingly, the data is provided on an “as is” “as available” basis only and may not reflect all real estate activity in the market”. © [2025] REsides, Inc. All rights reserved. Certain information contained herein is derived from information, which is the licensed property of, and copyrighted by, REsides, Inc.
We do not attempt to independently verify the currency, completeness, accuracy or authenticity of the data contained herein. All area measurements and calculations are approximate and should be independently verified. Data may be subject to transcription and transmission errors. Accordingly, the data is provided on an “as is” “as available” basis only and may not reflect all real estate activity in the market”. © [2025] REsides, Inc. All rights reserved. Certain information contained herein is derived from information, which is the licensed property of, and copyrighted by, REsides, Inc.
- 123 South St Unit 5
- 230 West Square
- 270 West Square
- 272 West Square
- 113 Cross Rd
- 307 East Ave
- 529 South Square
- 79 Kendall Dr
- 5 Woodland Ct
- 17 Bridgewater Dr
- 4 Wellington Ct
- 4 Wellington Dr
- 74 Bridgewater Dr
- 56 W Morningside Dr
- 8 Marlowe Way
- 2 Westfield Ct
- 50 Pebble Beach Cove Unit F111
- 50 Pebble Beach Cove Unit B115
- 50 Pebble Beach Cove Unit B115
- 50 Pebble Beach Cove Unit L113
