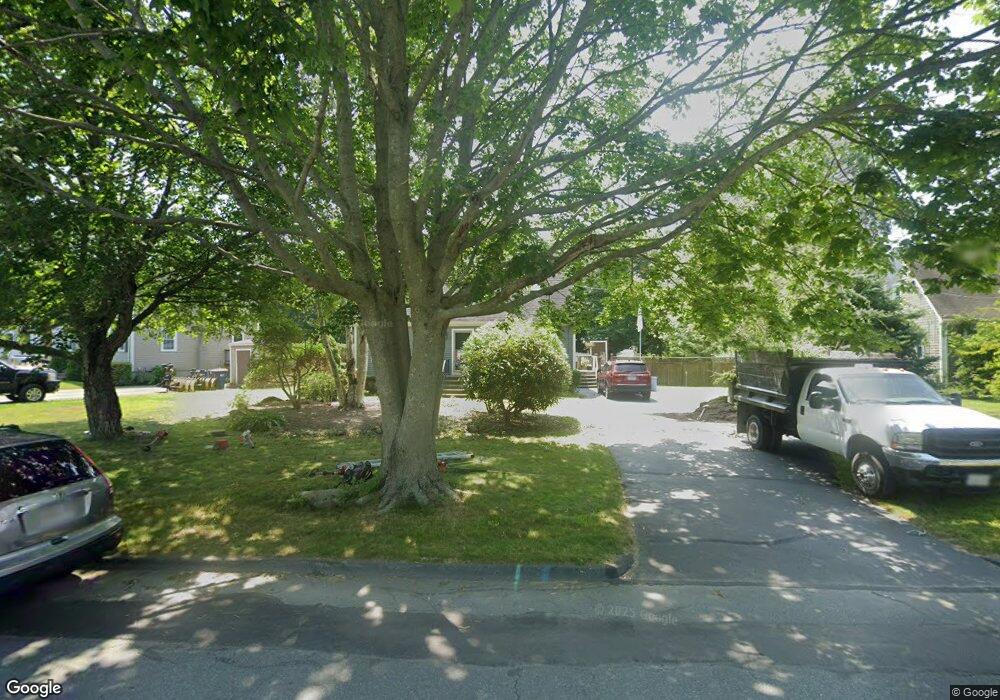
143 Spring St Fairhaven, MA 02719
Estimated Value: $539,000 - $561,000
3
Beds
2
Baths
1,685
Sq Ft
$329/Sq Ft
Est. Value
About This Home
This home is located at 143 Spring St, Fairhaven, MA 02719 and is currently estimated at $554,143, approximately $328 per square foot. 143 Spring St is a home located in Bristol County with nearby schools including Fairhaven High School, City On A Hill Charter Public School New Bedford, and St. Joseph School.
Ownership History
Date
Name
Owned For
Owner Type
Purchase Details
Closed on
Feb 16, 2022
Sold by
Harrison Scott P and Harrison Lynn
Bought by
Harrison Scott P and Harrison Lynn
Current Estimated Value
Home Financials for this Owner
Home Financials are based on the most recent Mortgage that was taken out on this home.
Original Mortgage
$151,000
Outstanding Balance
$120,413
Interest Rate
3.55%
Mortgage Type
New Conventional
Estimated Equity
$433,730
Create a Home Valuation Report for This Property
The Home Valuation Report is an in-depth analysis detailing your home's value as well as a comparison with similar homes in the area
Home Values in the Area
Average Home Value in this Area
Purchase History
| Date | Buyer | Sale Price | Title Company |
|---|---|---|---|
| Harrison Scott P | -- | None Available | |
| Harrison Scott P | -- | None Available |
Source: Public Records
Mortgage History
| Date | Status | Borrower | Loan Amount |
|---|---|---|---|
| Open | Harrison Scott P | $151,000 | |
| Closed | Harrison Scott P | $151,000 |
Source: Public Records
Tax History
| Year | Tax Paid | Tax Assessment Tax Assessment Total Assessment is a certain percentage of the fair market value that is determined by local assessors to be the total taxable value of land and additions on the property. | Land | Improvement |
|---|---|---|---|---|
| 2025 | $42 | $447,000 | $181,700 | $265,300 |
| 2024 | $3,995 | $432,800 | $181,700 | $251,100 |
| 2023 | $3,712 | $373,100 | $159,500 | $213,600 |
| 2022 | $3,607 | $352,900 | $148,400 | $204,500 |
| 2021 | $3,542 | $313,700 | $134,500 | $179,200 |
| 2020 | $3,470 | $313,700 | $134,500 | $179,200 |
| 2019 | $3,314 | $284,000 | $112,000 | $172,000 |
| 2018 | $3,161 | $269,000 | $106,800 | $162,200 |
| 2017 | $3,153 | $261,900 | $106,800 | $155,100 |
| 2016 | $3,145 | $258,200 | $106,800 | $151,400 |
| 2015 | $2,945 | $242,400 | $106,800 | $135,600 |
Source: Public Records
Map
Nearby Homes
- 181 Washington St
- 77 Adams St
- 8 Manor Dr
- 39 Christian St
- 145 Pleasant St
- 16 Ash St
- 15 School St
- 67 Bridge St
- 58 Washington St
- 00 Copeland St
- 33 Narragansett Blvd
- 0 Nulands Neck Unit 73286360
- 11 Lawton St
- 138 Main St Unit 13
- 8 Washington St
- 24 Academy Ave
- 2 Washburn Ave
- 24 Middle St
- 00 Huttleston Ave
- 32 Green St
Your Personal Tour Guide
Ask me questions while you tour the home.