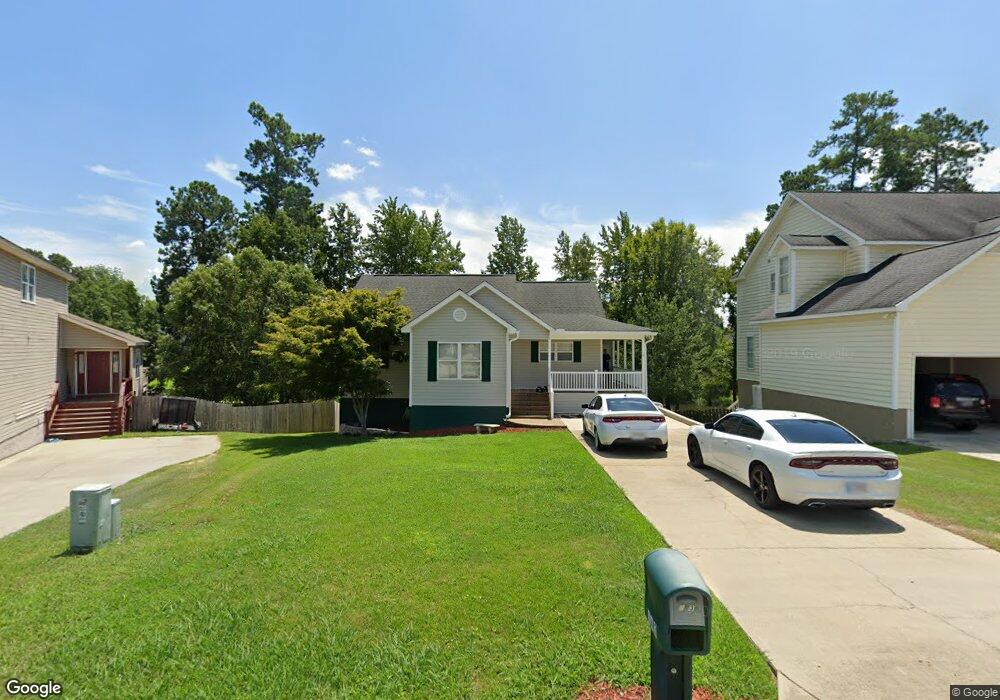
143 Stoney Pointe Dr Chapin, SC 29036
Estimated Value: $390,234 - $413,000
3
Beds
3
Baths
2,300
Sq Ft
$174/Sq Ft
Est. Value
About This Home
This home is located at 143 Stoney Pointe Dr, Chapin, SC 29036 and is currently estimated at $400,809, approximately $174 per square foot. 143 Stoney Pointe Dr is a home located in Lexington County with nearby schools including Chapin Elementary School, Chapin Intermediate, and Chapin High School.
Ownership History
Date
Name
Owned For
Owner Type
Purchase Details
Closed on
Apr 5, 2024
Sold by
Mohr Stephen and Mohr Amanda
Bought by
Spires Michael D
Current Estimated Value
Home Financials for this Owner
Home Financials are based on the most recent Mortgage that was taken out on this home.
Original Mortgage
$295,000
Outstanding Balance
$290,064
Interest Rate
6.9%
Mortgage Type
New Conventional
Estimated Equity
$110,745
Purchase Details
Closed on
Jul 2, 2018
Sold by
Pfannenstiel Randall and Pfannenstiel Leighann M
Bought by
Mohe Stephen and Mohr Amanda
Home Financials for this Owner
Home Financials are based on the most recent Mortgage that was taken out on this home.
Original Mortgage
$235,000
Interest Rate
4.6%
Mortgage Type
VA
Purchase Details
Closed on
Sep 10, 2002
Sold by
Five Star Develop Corp Llc
Bought by
Pfannenstiel Randy
Purchase Details
Closed on
Jul 31, 2002
Sold by
Reggie Porter Bldrs Inc
Bought by
Wells Stephen E
Create a Home Valuation Report for This Property
The Home Valuation Report is an in-depth analysis detailing your home's value as well as a comparison with similar homes in the area
Home Values in the Area
Average Home Value in this Area
Purchase History
| Date | Buyer | Sale Price | Title Company |
|---|---|---|---|
| Spires Michael D | $395,000 | None Listed On Document | |
| Spires Michael D | $395,000 | None Listed On Document | |
| Mohe Stephen | $235,000 | None Available | |
| Pfannenstiel Randy | $33,000 | -- | |
| Wells Stephen E | $254,000 | -- |
Source: Public Records
Mortgage History
| Date | Status | Borrower | Loan Amount |
|---|---|---|---|
| Open | Spires Michael D | $295,000 | |
| Closed | Spires Michael D | $295,000 | |
| Previous Owner | Mohe Stephen | $235,000 |
Source: Public Records
Tax History Compared to Growth
Tax History
| Year | Tax Paid | Tax Assessment Tax Assessment Total Assessment is a certain percentage of the fair market value that is determined by local assessors to be the total taxable value of land and additions on the property. | Land | Improvement |
|---|---|---|---|---|
| 2024 | $2,263 | $9,400 | $3,200 | $6,200 |
| 2023 | $0 | $9,400 | $3,200 | $6,200 |
| 2020 | $6,107 | $9,400 | $3,200 | $6,200 |
| 2019 | $6,107 | $14,100 | $4,080 | $10,020 |
| 2018 | $951 | $6,566 | $1,600 | $4,966 |
| 2017 | $927 | $6,566 | $1,600 | $4,966 |
| 2016 | $950 | $6,565 | $1,600 | $4,965 |
| 2014 | $1,029 | $7,138 | $1,971 | $5,167 |
| 2013 | -- | $7,140 | $1,970 | $5,170 |
Source: Public Records
Map
Nearby Homes
- 100 Palm St
- 117 Bay Front Dr
- 510 Lilypad Ct
- 0 Dreher Island Rd Unit 21647709
- 0 Dreher Island Rd Unit 587193
- 409 Dutchman Shores Cir
- 3006 Chilmark Rd
- 161 Dutchman Shores Cir
- 814 Dutchmaster Dr
- 1431 Saugus Ct
- 368 Frick Ct
- 147 Ventnor Ave
- 147 Stuck's Point
- 108 Pennsylvania Ct
- 125 Northshore Dr
- 100 Baltic Ct
- 129 Monroe Preserve Dr
- 540 Lakeshore Dr
- 0 Mainsail Ln Unit 622256
- 417 Northshore Ct
- 139 Stoney Pointe Dr
- 139 Stoney Point Dr
- 147 Stoney Pointe Dr
- 135 Stoney Pointe Dr
- 131 Stoney Pointe Dr
- 155 Stoney Pointe Dr
- 131 Stoney Point Dr
- 136 Stoney Pointe Dr
- 127 Stoney Pointe Dr
- 128 Stoney Pointe Dr
- 159 Stoney Pointe Dr
- 116 Palm St
- 148 Stoney Pointe Dr
- 120 Palm St
- 163 Stoney Pointe Dr
- 123 Stoney Pointe Dr
- 124 Stoney Pointe Dr
- 240 Stoney Pointe Dr
- 124 Palm St
- 236 Stoney Pointe Dr