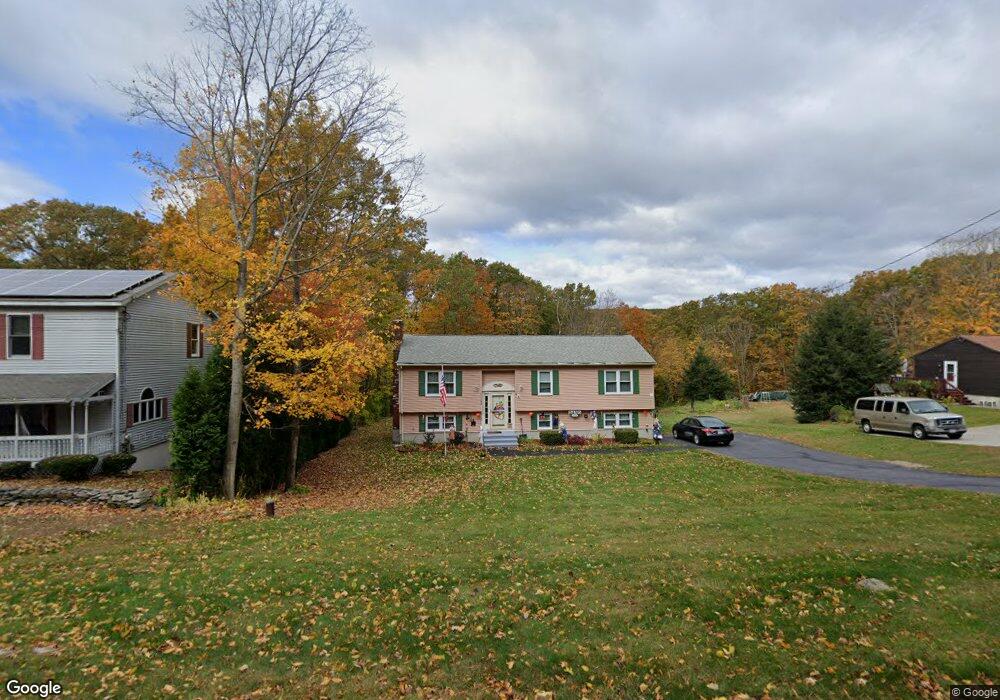
143 Sutton Rd Webster, MA 01570
Estimated Value: $464,000 - $520,021
3
Beds
2
Baths
1,194
Sq Ft
$412/Sq Ft
Est. Value
About This Home
This home is located at 143 Sutton Rd, Webster, MA 01570 and is currently estimated at $491,755, approximately $411 per square foot. 143 Sutton Rd is a home located in Worcester County with nearby schools including Park Avenue Elementary School, Webster Middle School, and Bartlett High School.
Ownership History
Date
Name
Owned For
Owner Type
Purchase Details
Closed on
May 31, 2007
Sold by
Dano George P and Dano Shirley E
Bought by
Dano Lt and Dano George P
Current Estimated Value
Purchase Details
Closed on
Dec 28, 2001
Sold by
Kaminski Michael A and Kaminski Debra H
Bought by
Manning Michael L and Manning Brenda L
Home Financials for this Owner
Home Financials are based on the most recent Mortgage that was taken out on this home.
Original Mortgage
$166,683
Interest Rate
6.61%
Mortgage Type
Purchase Money Mortgage
Purchase Details
Closed on
Dec 2, 1994
Sold by
Pelletier Bryan and Pelletier Sharon
Bought by
Szeredy Dev Corp
Purchase Details
Closed on
Mar 5, 1993
Sold by
Tremblay Leonard C and Tremblay Bernette
Bought by
Pelletier Bryan P and Pelletier Sharon
Create a Home Valuation Report for This Property
The Home Valuation Report is an in-depth analysis detailing your home's value as well as a comparison with similar homes in the area
Home Values in the Area
Average Home Value in this Area
Purchase History
| Date | Buyer | Sale Price | Title Company |
|---|---|---|---|
| Dano Lt | -- | -- | |
| Manning Michael L | $168,000 | -- | |
| Szeredy Dev Corp | $35,000 | -- | |
| Pelletier Bryan P | $33,500 | -- |
Source: Public Records
Mortgage History
| Date | Status | Borrower | Loan Amount |
|---|---|---|---|
| Previous Owner | Pelletier Bryan P | $180,000 | |
| Previous Owner | Pelletier Bryan P | $166,683 | |
| Previous Owner | Pelletier Bryan P | $100,000 |
Source: Public Records
Tax History
| Year | Tax Paid | Tax Assessment Tax Assessment Total Assessment is a certain percentage of the fair market value that is determined by local assessors to be the total taxable value of land and additions on the property. | Land | Improvement |
|---|---|---|---|---|
| 2025 | $4,350 | $366,200 | $81,300 | $284,900 |
| 2024 | $4,335 | $355,900 | $78,200 | $277,700 |
| 2023 | $4,024 | $321,900 | $77,900 | $244,000 |
| 2022 | $3,958 | $283,500 | $75,700 | $207,800 |
| 2021 | $4,029 | $266,800 | $75,700 | $191,100 |
| 2020 | $3,923 | $260,500 | $75,700 | $184,800 |
| 2019 | $3,668 | $239,300 | $76,900 | $162,400 |
| 2018 | $3,503 | $227,600 | $76,900 | $150,700 |
| 2017 | $3,209 | $212,100 | $75,300 | $136,800 |
| 2016 | $3,092 | $204,200 | $72,000 | $132,200 |
| 2015 | $2,763 | $188,200 | $64,800 | $123,400 |
Source: Public Records
Map
Nearby Homes
Your Personal Tour Guide
Ask me questions while you tour the home.