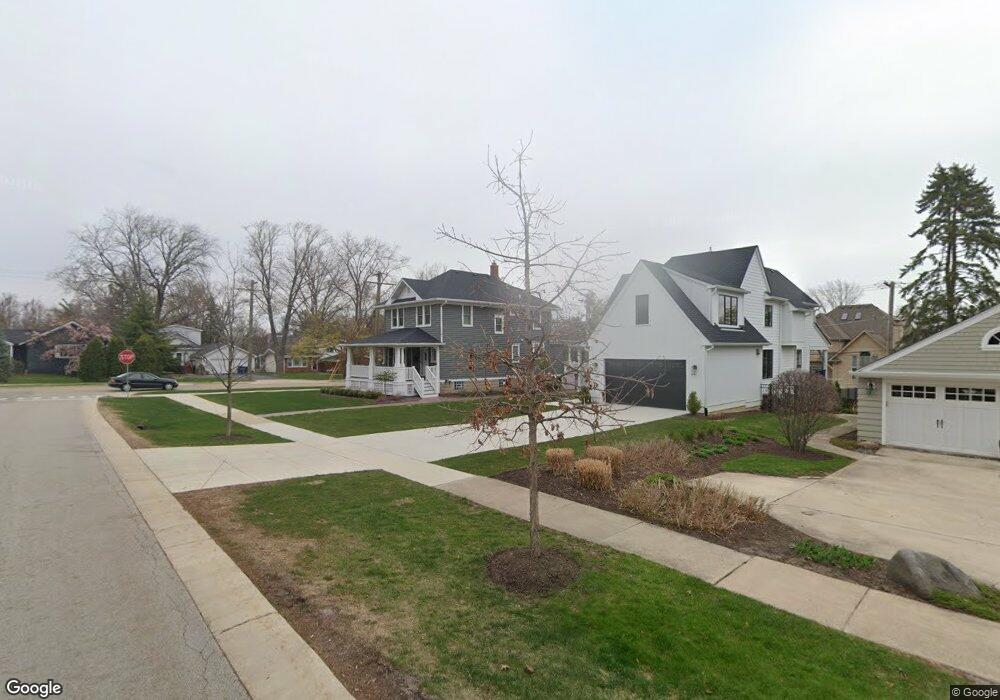
143 Tuttle Ave Clarendon Hills, IL 60514
Estimated Value: $684,300 - $1,336,000
4
Beds
2
Baths
2,060
Sq Ft
$445/Sq Ft
Est. Value
About This Home
This home is located at 143 Tuttle Ave, Clarendon Hills, IL 60514 and is currently estimated at $916,325, approximately $444 per square foot. 143 Tuttle Ave is a home located in DuPage County with nearby schools including Prospect Elementary School, Clarendon Hills Middle School, and Hinsdale Central High School.
Ownership History
Date
Name
Owned For
Owner Type
Purchase Details
Closed on
Jul 12, 2021
Sold by
Corvino Thomas R and Corvino Ann Marie
Bought by
Corvino Thomas and Thomas R Corvino Revocable Trust
Current Estimated Value
Home Financials for this Owner
Home Financials are based on the most recent Mortgage that was taken out on this home.
Original Mortgage
$333,000
Outstanding Balance
$252,638
Interest Rate
2.5%
Mortgage Type
New Conventional
Estimated Equity
$663,687
Purchase Details
Closed on
Dec 16, 2020
Sold by
Corvino Thomas R and Corvino Ann Marie
Bought by
Corvino Thomas R and Corvino Ann Marie
Purchase Details
Closed on
Oct 27, 2009
Sold by
Baez Selbye L
Bought by
Corvino Thomas R and Corvino Ann Marie
Home Financials for this Owner
Home Financials are based on the most recent Mortgage that was taken out on this home.
Original Mortgage
$417,000
Interest Rate
4.96%
Mortgage Type
Stand Alone Second
Create a Home Valuation Report for This Property
The Home Valuation Report is an in-depth analysis detailing your home's value as well as a comparison with similar homes in the area
Home Values in the Area
Average Home Value in this Area
Purchase History
| Date | Buyer | Sale Price | Title Company |
|---|---|---|---|
| Corvino Thomas | -- | New Title Company Name | |
| Corvino Thomas R | -- | None Listed On Document | |
| Corvino Thomas R | $440,000 | Multiple |
Source: Public Records
Mortgage History
| Date | Status | Borrower | Loan Amount |
|---|---|---|---|
| Open | Corvino Thomas | $333,000 | |
| Previous Owner | Corvino Thomas R | $417,000 |
Source: Public Records
Tax History Compared to Growth
Tax History
| Year | Tax Paid | Tax Assessment Tax Assessment Total Assessment is a certain percentage of the fair market value that is determined by local assessors to be the total taxable value of land and additions on the property. | Land | Improvement |
|---|---|---|---|---|
| 2024 | $9,533 | $168,479 | $65,040 | $103,439 |
| 2023 | $8,920 | $154,880 | $59,790 | $95,090 |
| 2022 | $8,689 | $151,710 | $58,570 | $93,140 |
| 2021 | $8,422 | $149,980 | $57,900 | $92,080 |
| 2020 | $8,252 | $147,010 | $56,750 | $90,260 |
| 2019 | $8,207 | $141,050 | $54,450 | $86,600 |
| 2018 | $7,775 | $138,490 | $54,160 | $84,330 |
| 2017 | $6,944 | $125,890 | $52,120 | $73,770 |
| 2016 | $6,255 | $110,960 | $49,740 | $61,220 |
| 2015 | $6,200 | $104,400 | $46,800 | $57,600 |
| 2014 | $6,121 | $99,350 | $45,500 | $53,850 |
| 2013 | $6,012 | $98,890 | $45,290 | $53,600 |
Source: Public Records
Map
Nearby Homes
- 410 Chicago Ave
- 309 E Naperville Rd
- 147 Chicago Ave
- 226 N Wilmette Ave
- 322 Park Ave Unit 2A
- 403 Burlington Ave
- 512 Blackhawk Dr
- 260 N Linden Ave
- 632 Independence Ave
- 303 N Cass Ave
- 509 Citadel Cir Unit 4
- 475 N Cass Ave Unit 212
- 416 N Cass Ave Unit 6
- 255 N Grant St
- 140 N Quincy St
- 313 E Des Moines St
- 116 W Naperville Rd
- 523 Hamilton Ave
- 372 55th St
- 346 55th St
- 141 Tuttle Ave
- 137 Tuttle Ave
- 408 Chicago Ave
- 142 Oxford Ave
- 144 Oxford Ave
- 140 Oxford Ave
- 414 Chicago Ave
- 135 Tuttle Ave
- 144 Tuttle Ave
- 140 Tuttle Ave
- 138 Oxford Ave
- 206 Oxford Ave
- 138 Tuttle Ave
- 136 Oxford Ave
- 418 Chicago Ave
- 136 Tuttle Ave
- 134 Oxford Ave
- 208 Oxford Ave
- 131 Tuttle Ave
- 134 Tuttle Ave