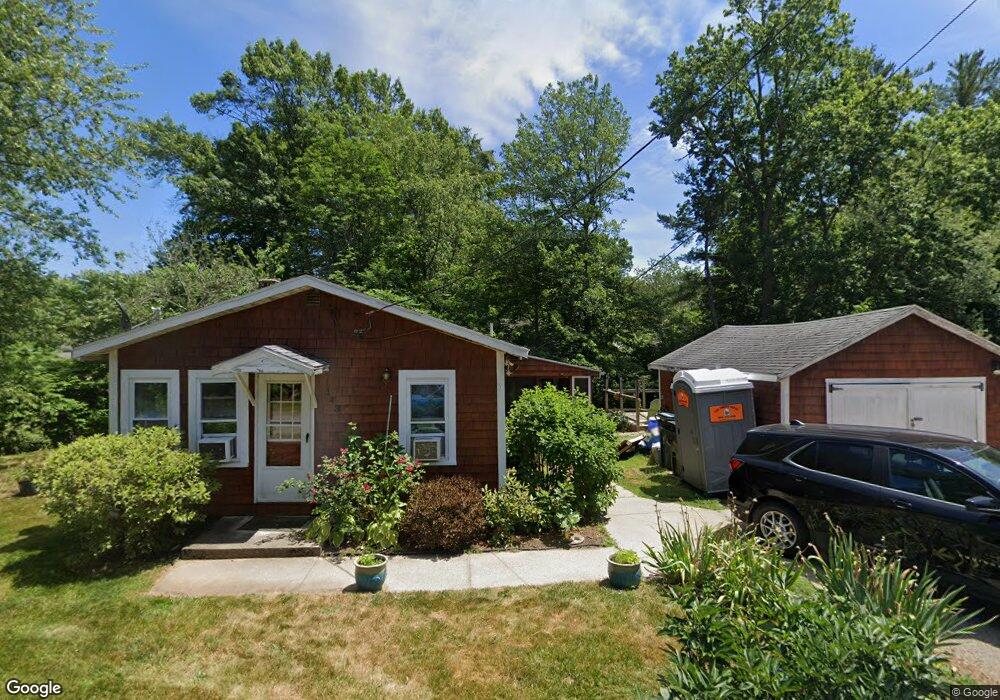
143 Union Park St Hanson, MA 02341
Estimated Value: $290,000 - $327,226
2
Beds
1
Bath
840
Sq Ft
$368/Sq Ft
Est. Value
About This Home
This home is located at 143 Union Park St, Hanson, MA 02341 and is currently estimated at $309,307, approximately $368 per square foot. 143 Union Park St is a home.
Ownership History
Date
Name
Owned For
Owner Type
Purchase Details
Closed on
May 12, 2025
Sold by
Prendergast Yennie W and Prendergast John
Bought by
143 Union Llc
Current Estimated Value
Purchase Details
Closed on
Jan 28, 2005
Sold by
Prendergast John
Bought by
Prendergast John and Wong Yennie
Home Financials for this Owner
Home Financials are based on the most recent Mortgage that was taken out on this home.
Original Mortgage
$212,000
Interest Rate
5.67%
Mortgage Type
Purchase Money Mortgage
Create a Home Valuation Report for This Property
The Home Valuation Report is an in-depth analysis detailing your home's value as well as a comparison with similar homes in the area
Home Values in the Area
Average Home Value in this Area
Purchase History
| Date | Buyer | Sale Price | Title Company |
|---|---|---|---|
| 143 Union Llc | $300,000 | None Available | |
| 143 Union Llc | $300,000 | None Available | |
| Prendergast John | -- | -- | |
| Prendergast John | -- | -- |
Source: Public Records
Mortgage History
| Date | Status | Borrower | Loan Amount |
|---|---|---|---|
| Previous Owner | Prendergast John | $212,000 | |
| Previous Owner | Prendergast John | $161,700 |
Source: Public Records
Tax History Compared to Growth
Tax History
| Year | Tax Paid | Tax Assessment Tax Assessment Total Assessment is a certain percentage of the fair market value that is determined by local assessors to be the total taxable value of land and additions on the property. | Land | Improvement |
|---|---|---|---|---|
| 2025 | $3,999 | $298,900 | $142,100 | $156,800 |
| 2024 | $3,886 | $290,400 | $138,000 | $152,400 |
| 2023 | $3,854 | $271,800 | $138,000 | $133,800 |
| 2022 | $3,801 | $251,900 | $125,400 | $126,500 |
| 2021 | $3,083 | $204,200 | $120,600 | $83,600 |
| 2020 | $3,037 | $198,900 | $116,500 | $82,400 |
| 2019 | $2,859 | $184,100 | $107,100 | $77,000 |
| 2018 | $2,826 | $178,500 | $103,000 | $75,500 |
| 2017 | $2,638 | $165,100 | $91,600 | $73,500 |
| 2016 | $2,679 | $161,900 | $91,600 | $70,300 |
| 2015 | $2,598 | $163,200 | $91,600 | $71,600 |
Source: Public Records
Map
Nearby Homes