Estimated Value: $352,000 - $382,212
4
Beds
1
Bath
1,926
Sq Ft
$189/Sq Ft
Est. Value
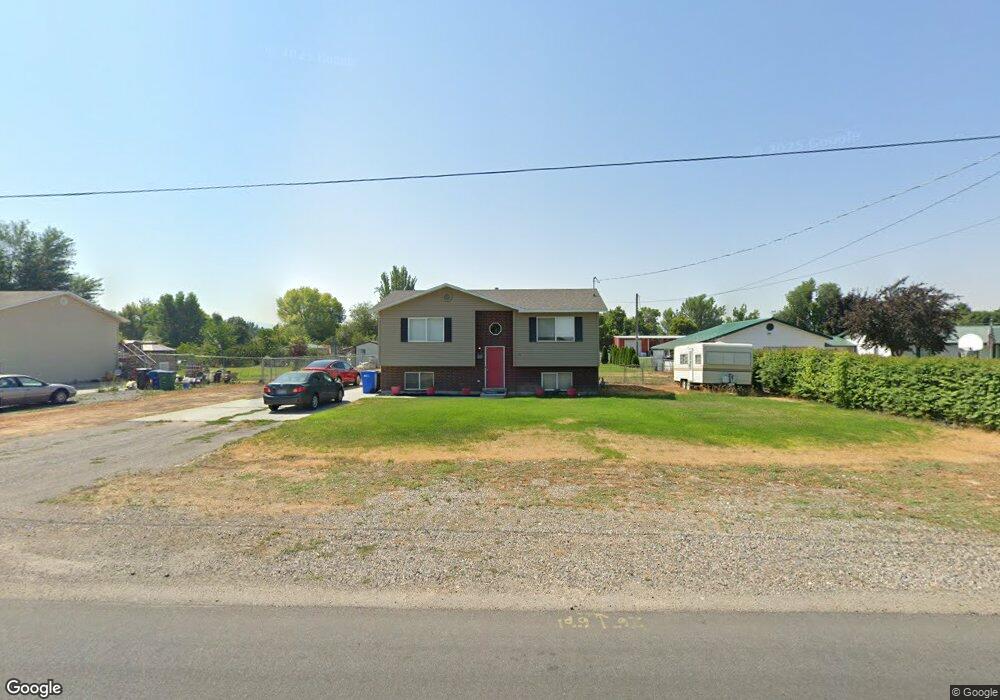
About This Home
This home is located at 143 W 300 N, Hyrum, UT 84319 and is currently estimated at $363,803, approximately $188 per square foot. 143 W 300 N is a home located in Cache County with nearby schools including Lincoln School, South Cache Middle School, and Mountain Crest High School.
Ownership History
Date
Name
Owned For
Owner Type
Purchase Details
Closed on
Apr 5, 2013
Sold by
Passey Zachary C and Passey Zachary Clarence
Bought by
Passey Zachary C
Current Estimated Value
Home Financials for this Owner
Home Financials are based on the most recent Mortgage that was taken out on this home.
Original Mortgage
$148,533
Outstanding Balance
$103,641
Interest Rate
3.37%
Mortgage Type
New Conventional
Estimated Equity
$260,162
Purchase Details
Closed on
Aug 28, 2009
Sold by
Critter Haven Construction Llc
Bought by
Passey Zachary Clarence
Home Financials for this Owner
Home Financials are based on the most recent Mortgage that was taken out on this home.
Original Mortgage
$153,316
Interest Rate
5.09%
Mortgage Type
New Conventional
Purchase Details
Closed on
Jan 20, 2009
Sold by
Auman Randy and Auman Revocable T Marguerite B
Bought by
Critter Haven Construction Llc
Create a Home Valuation Report for This Property
The Home Valuation Report is an in-depth analysis detailing your home's value as well as a comparison with similar homes in the area
Home Values in the Area
Average Home Value in this Area
Purchase History
| Date | Buyer | Sale Price | Title Company |
|---|---|---|---|
| Passey Zachary C | -- | None Available | |
| Passey Zachary Clarence | -- | Pinnacle Title Ins Agency | |
| Critter Haven Construction Llc | -- | Pinnacle Title Ins Agency |
Source: Public Records
Mortgage History
| Date | Status | Borrower | Loan Amount |
|---|---|---|---|
| Open | Passey Zachary C | $148,533 | |
| Closed | Passey Zachary Clarence | $153,316 |
Source: Public Records
Tax History Compared to Growth
Tax History
| Year | Tax Paid | Tax Assessment Tax Assessment Total Assessment is a certain percentage of the fair market value that is determined by local assessors to be the total taxable value of land and additions on the property. | Land | Improvement |
|---|---|---|---|---|
| 2025 | $1,386 | $199,060 | $0 | $0 |
| 2024 | $1,486 | $199,225 | $0 | $0 |
| 2023 | $1,537 | $197,085 | $0 | $0 |
| 2022 | $1,604 | $197,085 | $0 | $0 |
| 2021 | $1,167 | $220,860 | $65,740 | $155,120 |
| 2020 | $1,129 | $200,627 | $65,740 | $134,887 |
| 2019 | $1,054 | $176,007 | $41,120 | $134,887 |
| 2018 | $1,000 | $161,555 | $41,120 | $120,435 |
| 2017 | $1,022 | $85,700 | $0 | $0 |
| 2016 | $1,046 | $79,985 | $0 | $0 |
| 2015 | $978 | $79,985 | $0 | $0 |
| 2014 | $955 | $79,820 | $0 | $0 |
| 2013 | -- | $79,820 | $0 | $0 |
Source: Public Records
Map
Nearby Homes